When trading Forex, you probably already know that you need to study technical analysis and learn about common indicators like MA, Bollinger Bands, RSI, or fundamental analysis data such as CPI, PPI, ISM. However, in this article, I will share with you top 5 Best FOREX trangding tools, along with instructions on how to use them to make your trading process as ‘perfect’ as possible. Let’s find out together
Contents
5 Best FOREX trading Tools 2025
Currency Strength Meter
This Best FOREX trading Tools helps you measure the strength of various currency pairs against the USD.
The higher the value, the stronger the currency pair. The lower the value, the weaker the currency pair.
Here is an example of a currency strength meter:
There are many different currency pairs, and this tool can help you choose the most volatile pairs or currencies with strong volatility for research and trading opportunities.
Forex Market Hours
You may already know that the Forex market is open 24 hours a day for five days a week.
However, do you know that Forex has four trading sessions?
Do you know the exact opening and closing times of these sessions according to your country’s time zone?
Instead of memorizing cumbersome timeframes, I often use the ForexFactory Forex Clock tool. Here are the steps:
- First, visit the Forex Factory website: https://www.forexfactory.com/
- Click on the ‘Time’ button at the top right of the page.
- Choose your time zone (Example: GMT+7 for Vietnam). Set your time zone to GMT+7.

After setting your time zone, scroll down, and you will see the ‘Sessions‘ section. It will tell you which trading session is currently open, converted to your time zone.

You might wonder how knowing the trading session hours can benefit you. Knowing the schedules of these market sessions is crucial for your trading because it helps you determine when to trade and when not to, especially if you’re a short-term trader. Specifically:
- If you want to trade during high volatility, the London session is the best because it usually has the most significant price movements.
- The overlap between the London and New York sessions is the best time to trade because it has the highest trading volume.

Donchian Channels
Donchian Channels are a useful Forex indicator that I recommend you try. You might be familiar with Bollinger Bands, but Donchian Channels offer much more. Whether you are a day trader or a swing trader, this tool can be helpful. To use Donchian Channels, you can go to the indicator section and search for ‘Donchian.’
But what are Donchian Channels? They provide information about the highest high and the lowest low of a price.
So, if you want to know the highest high and lowest low of the price for the last 50 days, you can open a 50-period Donchian Channel, and it will display like the image below:

So, how do you use it? There are two main ways:
– Trading Pullbacks:
The Donchian Channel indicator consists of three main lines:
- Upper Line
- Base Line (the line in the middle)
- Lower Line
If you’re looking to trade pullbacks, you should wait for the price to close below the Base Line in an uptrend. Then enter the trade when it closes above the middle channel.

– Trading Breakouts:
If you’re looking to trade by catching breakout signals, you can wait for the price to close above the Upper Line. The Donchian Channel indicator is highly useful as it precisely indicates breakout points.

Pip Value Calculator
If you’re new to the Forex market and have opened a small account, you might be wondering about the size of 1 lot, what a lot is, and how many lots you should trade, 1 lot, 100 lots?
However, when placing trades, you might notice that each pip movement can significantly impact your account, causing it to lose 100, 1000 USD.

It’s not surprising when the accounts of some new traders suddenly vanish after they click to trade.
Therefore, understanding your pip value is crucial. Here are some basic terms:
–Pip is an abbreviation for “percentage in point.” It is the unit of measurement for changes in the exchange rate between two currencies. For example, the pip value of XAUUSD is 0.01. The pip value of US500 is 0.1. The pip value of OILUSD is 0.01.
– The value of each pip represents the change in your Profit & Loss (P&L) if the price moves 1 pip. For example, if you are trading EUR/USD and you buy 100,000 units of it, what is the impact on your P&L if EUR/USD moves 1 pip? The value of each pip is 0.0001 x 100,000 = 10 USD per pip. This means that for every 1 pip increase or decrease in EUR/USD, your trade will result in a profit or loss of 10 USD.
If you find it complex to calculate this manually, don’t worry; there are many available tools. The simplest one I often use is the tool provided by Forextime:
It’s very simple; you just select the trading pair, enter the number of PIPs, and the lot size (number of lots) you are trading. For example, if I’m trading 10 lots of gold, if the XAUUSD price changes by 20 PIPs, I will make/lose 200 USD.

However, once you know the value of 1 pip, you need to know how to use it to calculate the appropriate trade volume for your account.
So, learn how to calculate the size of each trade most suitable for your account using the following formula:
TRADE SIZE = AMOUNT YOU’RE WILLING TO LOSE / (STOP LOSS IN PIPS * VALUE PER PIP)
For example:
- The amount you are willing to risk = 2% of 1000 dollars = 20 USD.
- The trading pair is EUR/USD, and the value of each pip for 1 standard lot is 10 USD.
- The Stop Loss in pips: Anticipated Stop Loss point is 50 pips from the Entry.
⇒ Applying the formula above, we get:
Trade Size = 20 / (50 * 10) = 0.04
So, with a total account balance of 1000 USD, you are willing to risk 20 USD, and you anticipate a Stop Loss point 50 pips away from the Entry. Therefore, you can enter a maximum trade size of 0.04 Lots of EUR/USD, which is appropriate.
TIP: If you find it difficult to calculate, you can create an Excel spreadsheet with the above formula to easily determine the suitable trade size for each transaction.
Alternatively, you can use the following link: https://www.myfxbook.com/forex-calculators/position-size
They will help you calculate quickly. For example, based on the data mentioned above:

Tool 5: Economic Calendar
When trading Forex, in addition to technical analysis, fundamental analysis is crucial. Fundamental analysis involves data such as GDP, interest rates, inflation, non-farm payrolls, and many other important economic indicators.
And the timing of when this information is released is consolidated into an ECONOMIC CALENDAR. The economic calendar is one of the most effective tools for analyzing the market based on news events, and it is frequently used by traders.
For example, here is the economic calendar provided by Investing:
Alternatively, I recommend using ForexFactory. Here’s how to use it:
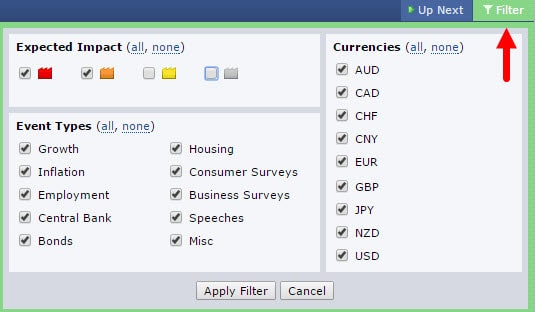
After selecting the appropriate time zone, remember to FILTER the news events because not all news events impact the market significantly.
- Click on the “Calendar” tab at the top of the page.
- Then, click the “Filter” button in the upper right corner of the page.

- For the “Expected Impact” section, mark the red and orange colored boxes. This means the Forex Factory calendar will only reflect high and medium-impact news events (you can tick the yellow box as well if you want to see low-impact events).
- For the “Event Types” section, it’s best to select ALL because you cannot predict which events will have a greater impact.
- For the “Currencies” section, choose the country whose news you want to follow. However, I also recommend selecting ALL because these are all major currencies of large economies.
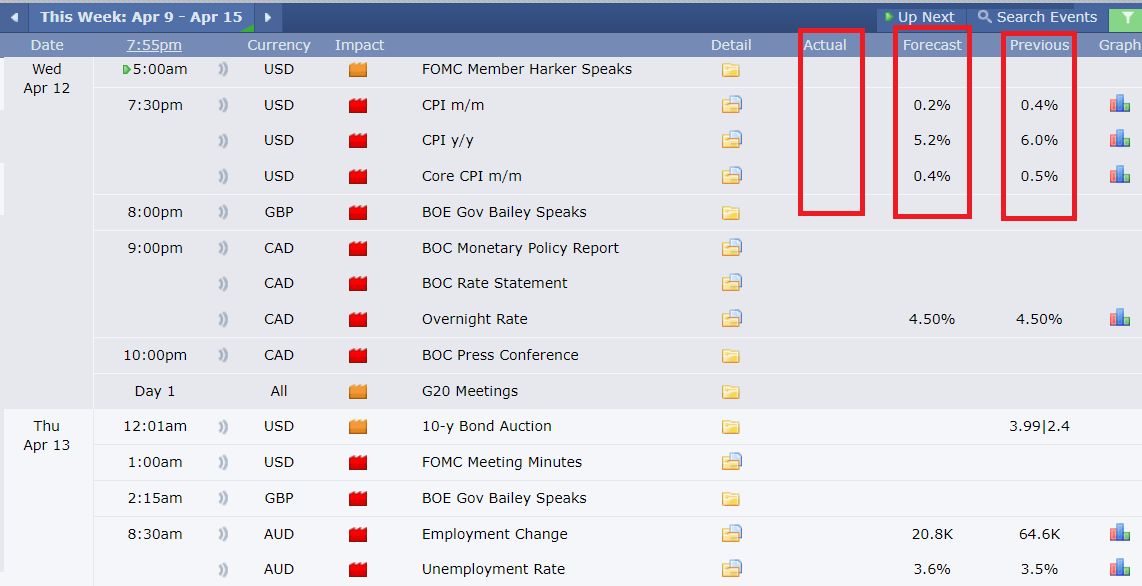
Once you’ve set up these two steps, you will have an updated table of important news events like this:

Reading the data, you will be interested in the following three columns:
-
Actual: The most recent data from the reporting period.
-
Forecast: The latest forecasted data for the reporting period.
-
Previous: The data from the previous period.
Apart from just looking at how the ACTUAL data compares to the FORECAST, the most important thing is to compare the ACTUAL data with the FORECAST data. If these two results differ, it can cause market volatility.
For example, when reading the Non-Farm Payrolls report:
- Actual > Forecast: Better than expected, a positive direction (unemployment rate decreases, employment rate increases) can lead to a strong USD, causing USD/XXX pairs to rise, and XXX/USD pairs to fall.
- Actual < Forecast: Worse than expected, a negative direction (unemployment rate increases) can affect the USD, causing it to weaken. In this case, USD/XXX pairs would decrease, and XXX/USD pairs would rise.
These are the five best Forex Trading Tools that I believe every trader should know and regularly use. I’m confident that these Forex tools are highly versatile and can bring benefits to your trading. Remember to combine their usage.
Related post: What is Forex Trading Journal? How to creat it effectively?
- You can use the Economic Calendar to understand how the market may continue and prioritize trading in a particular trend.
- You can use the Currency Strength Meter to decide which Forex pair to trade.
- You can use the Forex Clock to determine the best times for trading.
- You can use the Donchian Channel to calculate precise entry points.
- You can use the Pip Value Calculator to determine the appropriate trade size.
What about you? Have you tried any of these best Forex Trading tools mentioned above? How do you evaluate them? If you have any questions, please leave a comment, and I’ll be happy to answer. Thank you for reading, and I wish you successful trading.


