No matter whether you are using technical analysis or fundamental analysis when trading in the global Forex market, referring to and using an economic calendar is very important for any successful trading strategy. The Forex economic calendar is a useful tool for traders as it tells them when certain events are happening and these events can affect their trading decisions. By understanding the monthly and annual events that occur throughout the global economy, traders can use them as indicators of when to buy or sell assets in the financial market, especially the FOREX market.
- The Forex economic calendar lists scheduled events and data releases in chronological order
- The Forex economic calendar provides information, data about events that significantly impact the entire financial market.
- The economic calendar also helps classify the impact level of each event, as well as display both previous data & prior data for investors to conveniently compare.
- FOREX traders must regularly refer to the economic calendar to adapt timely to the market and have a sensible trading plan.
- There are some important indicators/events to particularly note in the economic calendar. It requires you to understand their nature, and know how to read and analyze them.
- The economic calendar provided by Forex Factory is one of the most useful calendars available today.
Contents
- 1 Guide on Forex Economic Calendar
- 1.1 What is an economic calendar?
- 1.2 Benefits of using an economic calendar in Forex
- 1.3 How to use the Forex economic calendar most effectively
- 1.4 Guide on How to View, Read, and Understand the Forex Economic Calendar
- 1.5 How to View Detailed News on Forex Factory
- 1.6 How to Analyze Some Important Data of the Economic Calendar
- 1.6.1 Interest Rates of Central Banks
- 1.6.2 Inflation Rate
- 1.6.3 Non-Farm Payrolls (NFP) Report
- 1.6.4 Gross Domestic Product (GDP)
- 1.6.5 Consumer Price Index (CPI)
- 1.6.6 Producer Price Index (PPI)
- 1.6.7 Purchasing Managers Index (PMI)
- 1.6.8 Industrial Production Index (IPI)
- 1.6.9 Consumer Confidence Index (CCI)
- 1.6.10 Retail Sales
- 1.7 Forex Trading Strategies with the Economic Calendar
Guide on Forex Economic Calendar
What is an economic calendar?
An economic calendar is a schedule of data releases and news related to major global economic events, capable of impacting the global financial market. It is a very important source of information for traders as these events can affect the prices of financial assets and investor sentiment in the market.
There are many economic events in a calendar. However, in general, these events are usually divided into two:
- Lagging indicators – Lagging indicators are indicators that measure output that has already occurred in the market. For example: an economic data like inflation is a lagging indicator because the inflation has already occurred.
- Leading indicators – Leading indicators are indicators used to predict the future. For example, consumer confidence can help predict consumer spending and even overall economic output.
Benefits of using an economic calendar in Forex
The economic calendar is very important as it provides real-time information about economic news and trends, allowing individuals to make more informed investment and spending decisions. These calendars are an essential tool for economists, business experts, and even ordinary traders. They can also help businesses predict changes in consumer demand and economic conditions, as well as plan more effectively for the future. Whether people are interested in stocks or currencies, the economic calendar always helps them stay ahead of major economic announcements, thereby enabling them to make better decisions.
The Forex economic calendar will highlight important fundamental news that is about to appear, which will significantly affect the Forex market. Especially for day traders, keeping updated with the news is indispensable.
Examples:
- You don’t want to participate in a trade before a major event/news because you fear that your trade will be at risk.
- You want to try your luck, “gamble” with the news, find an opportunity to make a profit?
- You are holding a BUY/SELL order, you worry that the news might affect your position?
To master the above, the Forex economic calendar will be an indispensable tool for you.
Most economic calendars will have a brief description for each event. For example: the release of inflation data will have a publication time according to schedule, country of origin, and data details. You will see both the previous period’s data and the forecast data to easily compare with the actual data.
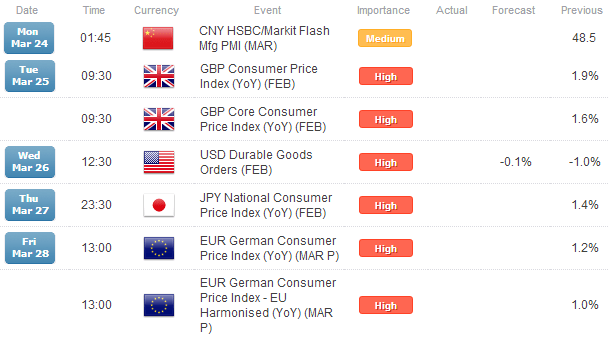
Furthermore, some economic calendars also mark the importance level of each event according to their expected market impact. Therefore, thanks to the economic calendar, you will easily grasp which events are worth attention and which can be overlooked.
In general, the benefits of the economic calendar can be summarized as follows:
- It will help you not be surprised when events occur. Understand what the market is like, why it is that way, and avoid panic.
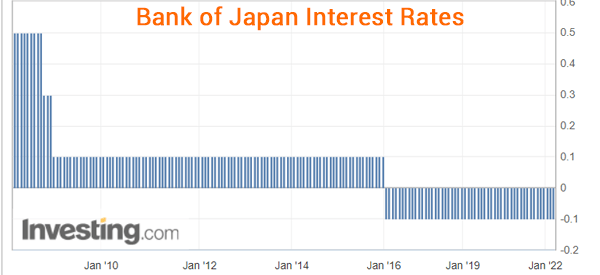
- It helps you analyze data. For example, as shown below, you can use the data in the economic calendar to understand trends. In this image, we see that the Bank of Japan has maintained negative interest rates since 2016.
- The Forex economic calendar will help you establish your trading strategy before major events and manage risk: for example, you may avoid trading at times when important news is about to happen, or consider setting a Stop Loss if the news is expected to be unfavorable for your trade.
Note that, there are many risks caused by high-impact data. For example: If the data or event goes against expectations, there can be many fluctuations, even causing a panic sell-off situation due to disappointing data. Traders need to pay close attention and closely follow the economic calendar to timely understand what is happening, thereby being able to react quickly.
How to use the Forex economic calendar most effectively
If you are a beginner, you may not be familiar with how most economic releases and news events affect certain currency pairs. However, you can start by focusing on two to three currency pairs and observing their reaction to related news events. Do not trade more than five currency pairs when starting because you are still developing your trading skills.
You can see how each pair reacted to specific news events in the past, from which you can gradually predict how this currency pair will react if a similar scenario occurs in the future.
BUT – never assume that the FOREX currency pair you are trading will react exactly as it did to a previous news release because each moment on the foreign exchange market is unique. Therefore, you must always use appropriate risk management for all your trades, even those that seem promising.
A practical example of how to use the Forex economic calendar: Suppose there is an upcoming data release, you will necessarily have to compare the previous figure with the forecast figure to see if the trend is getting better or worse. For example, if the previous figure for inflation in the Eurozone (Consumer Price Index/CPI) was 5.9% and the forecast is 6.1%, then this trend seems to be increasing. And if an inflation figure is much higher than forecast, it will affect the currency because the market’s expectation of interest rate increases will rise.
However, it is important to maintain a balanced approach to economic releases and not overreact.
Guide on How to View, Read, and Understand the Forex Economic Calendar
If you are using TradingView or MetaTrader 5 (MT5), the economic calendar is integrated into the system. More commonly, there are many websites that provide an economic calendar for investors and traders to easily look up and update information. The most popular ones are:
– Investing.com’s Economic Calendar: https://www.investing.com/economic-calendar/
– Forexfactory’s Economic Calendar: https://www.forexfactory.com/calendar
I recommend using the Forex Factory Calendar, as their calendar is easy to set up and easy to observe and analyze. Here are the instructions on how to read data, read and analyze the economic calendar with Forex Factory:
Step 1: Choose Your Time Zone
- First, visit the website: Forex Factory: https://www.forexfactory.com/
- Select the “Time” button at the top right of the page
- Then, choose your time zone (In Vietnam, it’s GMT+7).
This way, you will know when important news will take place according to Vietnam time.

Step 2: Filter Important News
Forex Factory provides a lot of different news from many countries around the world, such as CPI, PPI, Retail Sales, Inflation, Central Banks, etc. But not all news affects the market because they are not major news events.
Therefore, what needs to be done is FILTER NEWS, meaning only paying attention to important news that affects the currency pair you are trading. The steps are as follows:
- Select the “Calender” tab at the top of the page
- Then select the “Filter” button at the top right of the page.
You will see something like this…
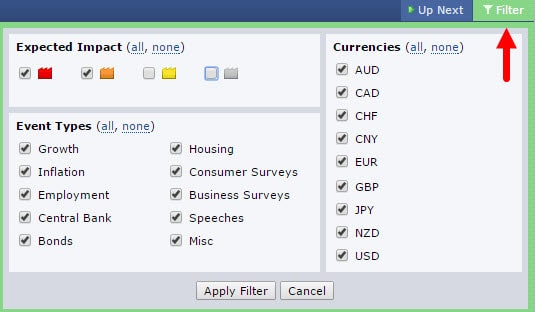
- In the Expected Impact section, mark the red and orange boxes. This means that the calendar on Forex Factory will only reflect news events with high and medium impact levels (if you want to see events with lower impact, you can also tick the yellow box – if desired).
- In the Event Types section, it’s best to choose ALL, which means you will see information from the entire economy (or you can skip data if you want).
- In the Currencies section, choose the currency for which you want to follow the news. But I also advise you to choose ALL, as these are the main currencies of major economies, and they will provide you with important information about what is happening around the world. But if not, then always prioritize USD, EUR, GBP, JPY.., or specifically choose the currency you often trade.
Step 3: Read Data with Forex Factory
After setting up the above two steps, we will have a table updating important news like this:
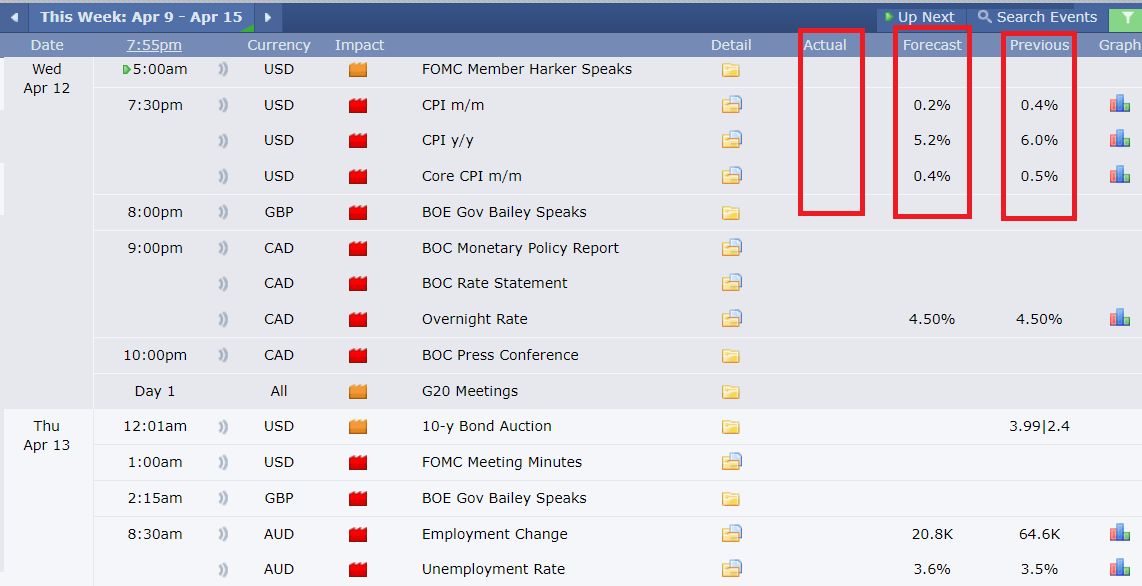
When reading data, pay attention to the following three columns:
- Actual: The latest data for the reporting period.
- Forecast: The latest forecast data for the reporting period.
- Previous: Data from the previous period.
Besides looking at what the ACTUAL is and comparing it to the previous data, the most important thing is to compare the ACTUAL data with the FORECAST data. Just a deviation between these two results can cause market volatility. (The reason is that prices usually run ahead according to FORECAST).
Details about how these data changes will positively or negatively affect the market require you to have BASIC knowledge of macroeconomics and know something about this indicator.
Or there’s another way, that is to click on the Detail part, it will provide you with the most basic information about the data you are considering. For example:
How to View Detailed News on Forex Factory
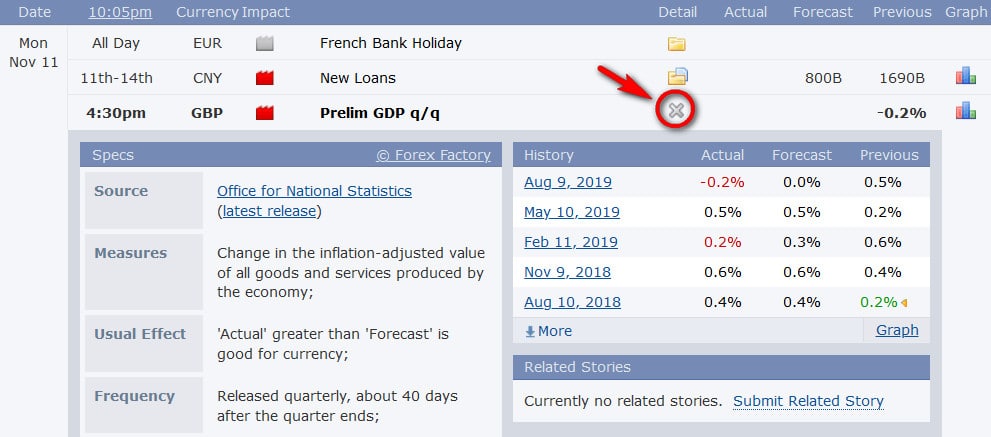
Additionally, if you click on the chart icon, it will give you detailed information about previously released data:
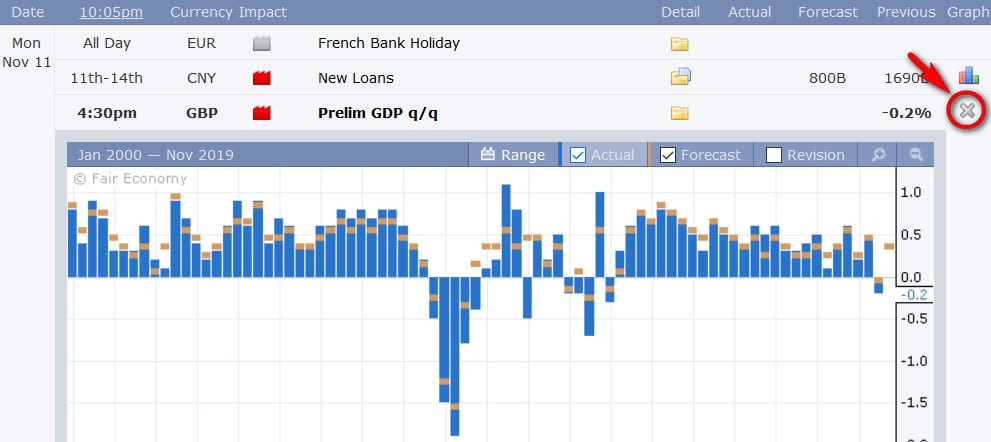
With this chart, it can easily help you detect the trend of economic data, thereby giving you an idea for a longer-term trade. For example, the image above shows the UK’s GDP for 2019, indicating a downward trend. With this data, you might prioritize SHORT rather than LONG for GBP.
How to Analyze Some Important Data of the Economic Calendar
Although the Forex economic calendar will mark for you the news and data with the highest impact on the market. However, to make good use of the economic calendar, it requires you to UNDERSTAND that data, so you can analyze whether the data increase/decrease, lower or higher than forecast is good or bad.
There are up to hundreds of different indicators. If you are not a professional analyst, you probably won’t know them all. However, at the very least, you should equip yourself with knowledge about the following indicators/events:
Interest Rates of Central Banks
Always pay attention to the interest rates of the 8 major central banks around the world, including: US Dollar (USD), Euro (EUR), Japanese Yen (JPY), British Pound (GBP), Canadian Dollar (CAD), Swedish Kronor (SEK), Swiss Franc (CHF). As these are the leading economies in the world, and they also make up the DXY – the index of USD strength.
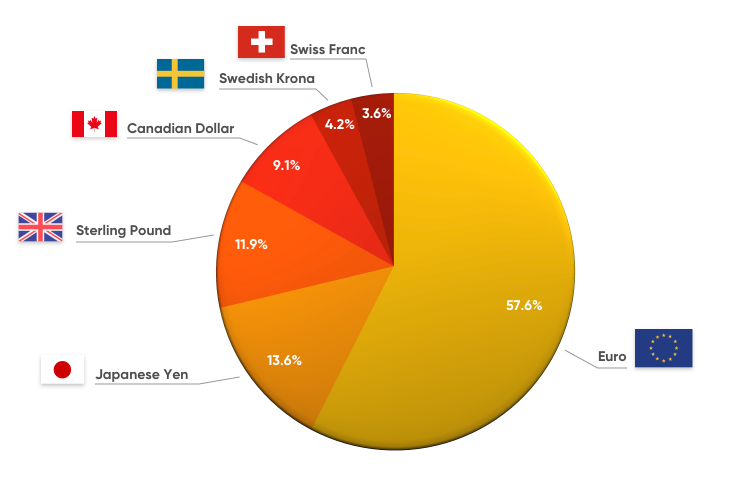
Especially the EURO (EUR). The EUR is the common currency of the European Union, consisting of 19 countries. In addition, do not overlook the CNY (Renminbi), as China is also one of the leading economies today.
However, the most important is still the US interest rate data (USD), often announced by the FED. When studying interest rates, the important thing is to consider what the central bank’s policy is like. It will be divided into two types:
- Hawkish: means the central bank has tightened monetary policy by increasing interest rates. Investors will transfer their money from other countries to earn a higher interest rate in the country that has just increased its rate. => Then, the demand for the currency of that country will increase and will increase the value of the currency.
- Dovish: means the central bank has eased monetary policy by lowering interest rates. This will cause investors to transfer their money to other countries to earn higher interest rates. => At this time, the demand for the currency of that country will decrease and the currency will depreciate.
Besides, you also need to pay attention to the actual increase/decrease in interest rates compared to the forecast. If the interest rate is as forecasted, the market will be less volatile, but if there is a big difference, the market will be highly volatile.
Inflation Rate
One thing that has a significant impact on a country’s currency and its exchange rate is the inflation rate. Inflation is the continuous increase in general prices of goods and services over time and is the depreciation of a currency.
A country with high inflation will see a decrease in the purchasing power of its currency, making domestic goods and services more expensive than foreign markets. At this time, the domestic currency will be in less demand, while people will prefer to use foreign currency. Conversely, when a country has low inflation (or even deflation), the purchasing power of the domestic currency increases. The demand for domestic currency will increase, raising its value.
Inflation increasing is not always bad for the economy; if it increases moderately, it is a sign that the economy is growing. However, in Forex trading, inflation rates have a significant impact on the exchange rates of currency pairs.
Inflation and interest rates are closely related to each other. Many countries try to balance interest rates with inflation rates skillfully, but the relationship between these two factors is very complex and difficult to manage. Central banks will look at inflation data, and then manipulate interest rates to adjust inflation as desired (as the FED has been doing recently).
- Increasing inflation ⇒ Depreciation of the domestic currency ⇒ Increase interest rates to improve the value of the domestic currency, reduce inflation.
It can be seen that inflation is an early indicator of interest rates and exchange rates. Inflation is likely to negatively affect the value and exchange rate of a currency. A low inflation rate does not mean that the exchange rate of that country is favorable, but – a high inflation rate will definitely negatively impact the exchange rate of that country.
Non-Farm Payrolls (NFP) Report
Non-Farm Payrolls (NFP) or the US non-agricultural payroll report is the most important economic indicator in Forex that every trader should learn about. The reason:
- GDP and employment levels are closely related. Any change in NonFarm data moves very closely with quarterly GDP changes. If GDP is released quarterly, then NFP is released monthly, hence NFP data timely and without delay reflects the current economic situation.
- The NonFarm report significantly impacts monetary policy. Remember, the FED always focuses on two dual objectives: stable prices and maximum employment. Therefore, Nonfarm data significantly influences market perception and the future of monetary policy in general.
A continuous decline in nonfarm payroll data indicates weakness and the potential for economic recession. Conversely, if the data shows a continuous increase in employment rates, it can indicate a healthy, developing economy with a low risk of recession.
Nonfarm Release Time: Regularly published on the first Friday of the month, at 19:30 (summer time) or 20:30 (winter time) Vietnam time.
Data in the Nonfarm Report: A Nonfarm report includes 3 data points:

- Labor Participation Rate (Non-farm Employment Change): The number of jobs in the industrial and service sectors created in the previous month.
- Unemployment Rate: The percentage of workers without a job but actively seeking new employment in the previous month.
- Average Hourly Earnings: The rate of earnings change in the previous month.
Non-Farm Data has a significant impact on the strength of the USD. In general, when you view this information each month, compare it with both the Previous Indicator and the Forecast Indicator. The difference between these three indicators will significantly affect investor sentiment and cause strong market volatility.
- Actual Data > Forecast: Better than expected, in a positive direction (unemployment rate decreases, employment rate increases) will strengthen the USD or USD/XXX pairs will Rise, conversely XXX/USD pairs will Fall.
- Actual Data < Forecast: Worse than expected, in a negative direction (unemployment rate increases), will affect the USD causing USD to fall, then USD/XXX pairs will Fall, and XXX/USD pairs will Rise.
Especially when analyzing Nonfarm, you need to understand more about the unemployment rate. If the economy is recovering but unemployment is increasing, then the unemployment rate acts as a lagging indicator. We often see unemployment continuing to rise even when GDP has bottomed out. Unemployment is also closely tied to consumer sentiment (affecting CCI). Prolonged unemployment causes extreme harm to consumer sentiment, and therefore affects consumer spending and economic growth.
But: An unemployment rate of 0% or too low is NOT GOOD at all. If there is no one unemployed, then in any industry when additional labor is needed, employers will have to increase wages to get them to work. And if wages keep increasing, it will lead to inflation, which is also not good for the economy.
Gross Domestic Product (GDP)
GDP stands for Gross Domestic Product, which is used to measure the market value of all final goods and services in a country. GDP data is typically reported quarterly or annually.
When GDP data of a country increases, it’s good news for that country’s currency. People will want to invest more in this currency, leading to an increase in its value.
Example: below about the GBP/USD pair, which rose strongly due to an economic report on the monthly GDP of the British Pound (GBP) from 0.0% to 0.3% (while the forecast was only an increase of 0.1%). This exceeded expectations, strengthening GBP.
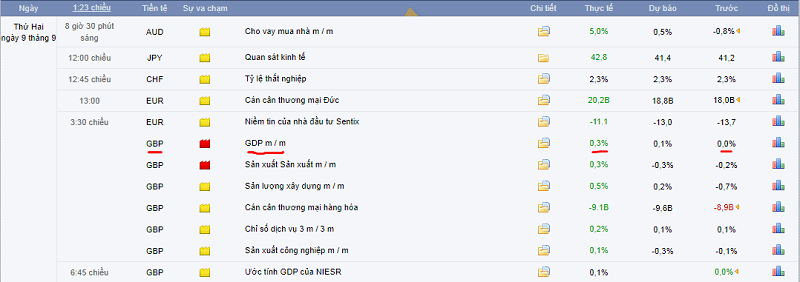
Price chart of GDP/EUR at the time the news was released:

Consumer Price Index (CPI)
CPI (Consumer Price Index) reflects the relative change in the average price of consumer goods over time.
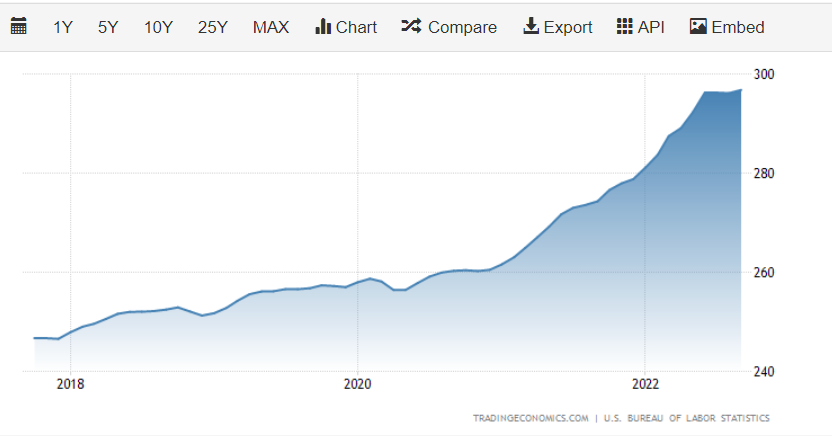
CPI is considered a tool to measure inflation. A rise in CPI means the average price level is increasing and vice versa. Therefore, analyzing CPI affects the Forex market similarly to analyzing inflation.
- A high CPI may prompt a central bank to raise interest rates in an effort to control inflation trends. When a country’s interest rate is higher, its currency is likely to strengthen as demand for it increases.
- Conversely, a lower CPI can lead to lower interest rates and reduced demand for a country’s currency, encouraging consumers to spend, putting more money into circulation, and generally stimulating a slowing economy.
The CPI is an important economic indicator in Forex, profoundly impacting the market. In addition to considering increases/decreases compared to the previous month, investors need to compare actual CPI with forecast CPI. For example: if the US CPI increases higher than previously forecasted, it creates the impression that monetary policy will be tightened in the near future, leading to a market increase for the US dollar.
Producer Price Index (PPI)
The Producer Price Index (PPI) is a measure of the average price levels of goods produced, indicating the inflationary pressures from the perspective of producers.
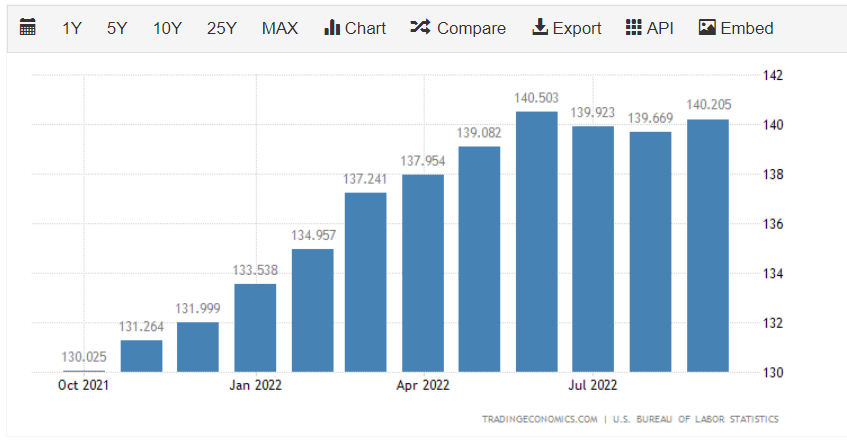
PPI often foreshadows the trend of the CPI index, making its significance to investors the ability to predict CPI. When PPI rises, there is a high likelihood that CPI will also increase.
Summary: If actual PPI figures are higher than forecasted, it is considered positive/upward trend for the currency of that country, while lower-than-forecasted figures are seen as negative/downward trend.
Purchasing Managers Index (PMI)
The Purchasing Managers Index (PMI) measures the “health” of the manufacturing sector, including new orders, inventory levels, production, supplier deliveries, and the employment environment.
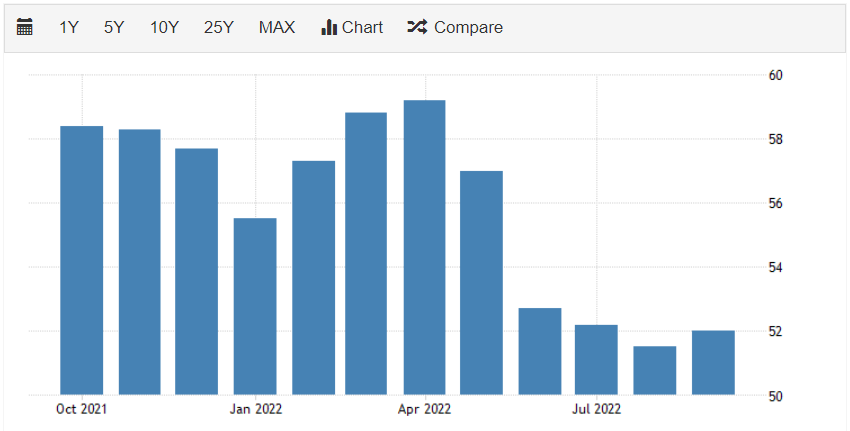
Purpose of PMI: PMI provides a comprehensive overview of the economic situation in both manufacturing and services. It reflects the “vibrancy” of buying and selling in the manufacturing sector over a month, and monthly changes clearly indicate the growth/weakening pace of the service and manufacturing sectors. It also helps predict other indicators such as the Consumer Price Index (CPI), Gross Domestic Product (GDP), etc., aiding in understanding the position of the economy and whether it meets policymakers’ expectations.
In summary, PMI is one of the most important economic indicators when examining the economic calendar. Increasing PMI data indicates a strong economic development, leading to a strengthening of the currency of that country.
Industrial Production Index (IPI)
The Industrial Production Index (IPI) measures the actual output in the manufacturing, mining, electric, and gas industries. IPI is published monthly by the Federal Reserve Board (FRB) and reported by the Conference Board.
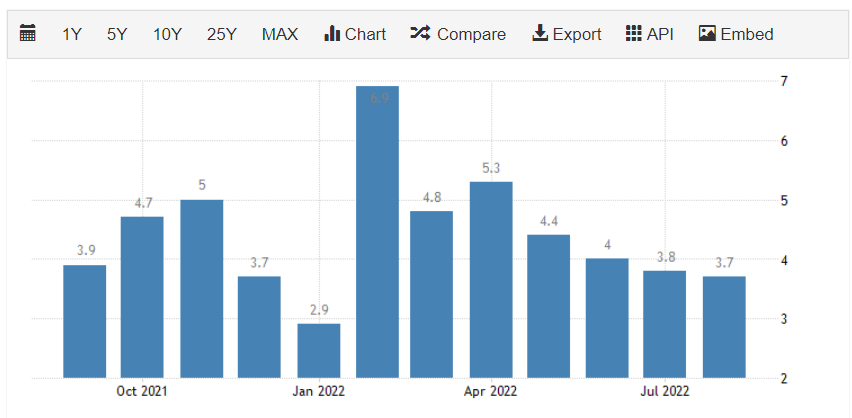
Although manufacturing represents only about 20% of the US economy, it has a significant impact on the overall US output, making it essential for Forex traders to closely monitor. Additionally, IPI correlates with the business cycle, so many analysts use IPI data as an early indicator of GDP.
IPI is often correlated with the value of a currency. When IPI is high, it signifies that the economic activity is improving in that country, directly contributing to GDP, leading to an increase in the value of the currency.
Consumer Confidence Index (CCI)
The Consumer Confidence Index (CCI) helps understand the level of optimism about the economic situation that consumers express through their saving and spending activities.
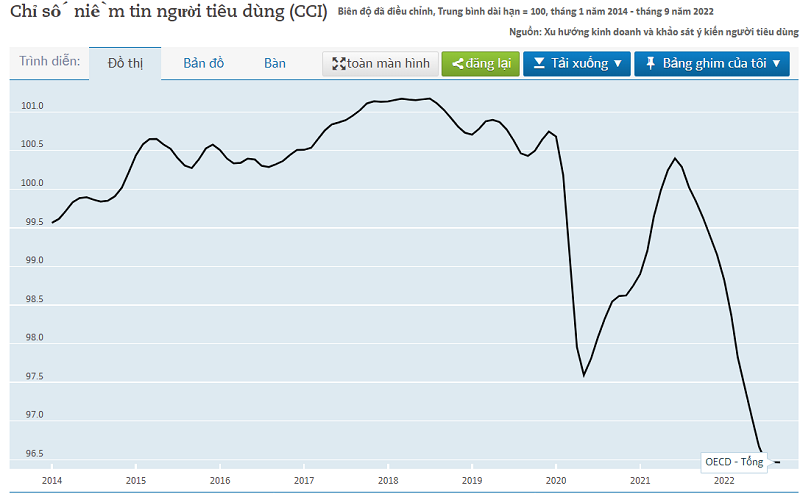
There are two types of indices in this group, namely the Consumer Sentiment Index (CSI) by the University of Michigan and the Consumer Confidence Index (CCI) by the Conference Board. CCI is published at the end of each month, while CSI is published twice a month.
- If consumers feel secure in their jobs and the current economic climate, they are likely to go out and spend more money, stimulating economic growth. At this time, CCI is usually displayed above 100.
- If consumers lack confidence in their jobs and the future of their economy, they are likely to stay home and cut back on spending. This is a sign of a gradually pessimistic economy, and CCI is usually displayed below 100 at this time.
In summary: If CCI increases, it is a sign that the economy will grow, and the value of the currency of that country will increase.
Retail Sales
Retail Sales (RS) provides an overview of the value of goods sold in the retail trade sector, and it is crucial in determining Gross Domestic Product (GDP) – a significant indicator of the economy.
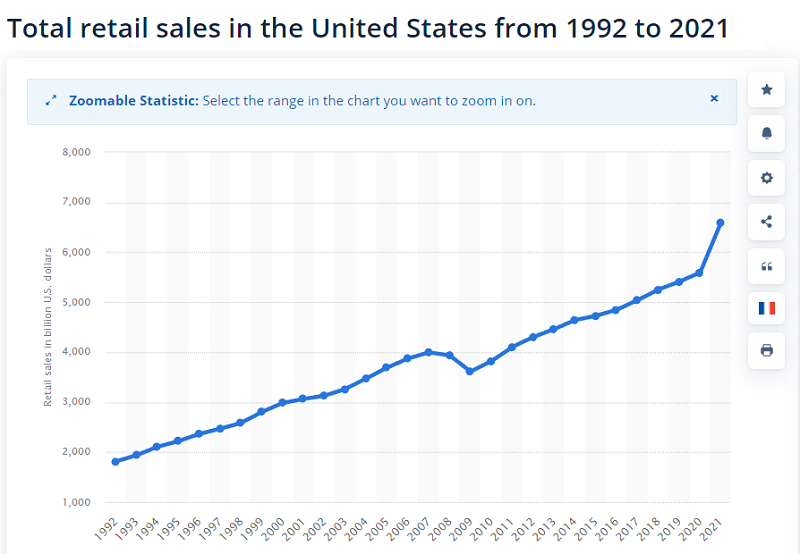
Usually, rising retail sales indicate the health of the economy, potentially positively affecting the USD, but there are also considerations about inflation. Conversely, weak retail sales will have a negative impact on the market and the US dollar.
Example: In October/November 2020, the US Census Bureau’s RS-Index report showed a decline in retail sales, acting as evidence of a sluggish economy. While there are many complex factors related to evaluating the US economy during the pandemic, disappointing RS-Index information led to a sharp decline in the USD/JPY exchange rate.

Additionally, there are other interesting economic events and data, such as:
- EIA Crude Oil Inventories
- OPEC Meetings
- New Home Sales Data
- ISM Data
- Durable Goods Orders
- Trade Balance
- …
Forex Trading Strategies with the Economic Calendar
Now that you understand what the Forex economic calendar is for and which data is most worth paying attention to, use the following tips/trading strategies to apply in the market:
-
Close Positions before News: Each time major news is released, the market will experience significant volatility. If you are not confident in your predictions, consider closing positions early to protect your account.
-
Scalping: This is a strategy where you open and close trades within a few minutes. Therefore, you can use this method during the time data is released, causing increased market volatility. The idea is to open multiple trades to take advantage of the increased volatility.
-
Pre-data Trading: Another approach is to trade before data is released. You can predict how much the data will be, whether it’s good or bad, and speculate on the “news.” However, this method is also risky, so it requires careful capital management and setting careful Stop Loss orders.
-
Pending Orders: You can use pending orders to trade Forex with the economic calendar. The goal is to take advantage of the volatility that occurs after data is released. If it breaks through support/resistance, it may start a new trend. For example, if the EUR/USD is trading at 1.1200, you can place a BUY STOP order at 1.1230 and a SELL STOP order at 1.1180. Instead of “betting on the news” as in the previous method, you wait for the price to break the trend, creating a specific trend and then start trading.
-
Position Trading: This means trading based on positions in the long term. For example, if the Fed sounds hawkish, you might sell the EUR/USD pair and vice versa.
-
Buying the Rumor, Selling the News: This strategy involves trading against actual data. For example, if NFP figures are strong, you may sell the US dollar if the data matches expectations.
In general, no matter which trading strategy you choose, understanding the market, macroeconomic knowledge, and indicators, as well as knowledge of technical analysis, are essential. Prioritize trades in areas with the best risk:reward ratios (usually around key support/resistance).
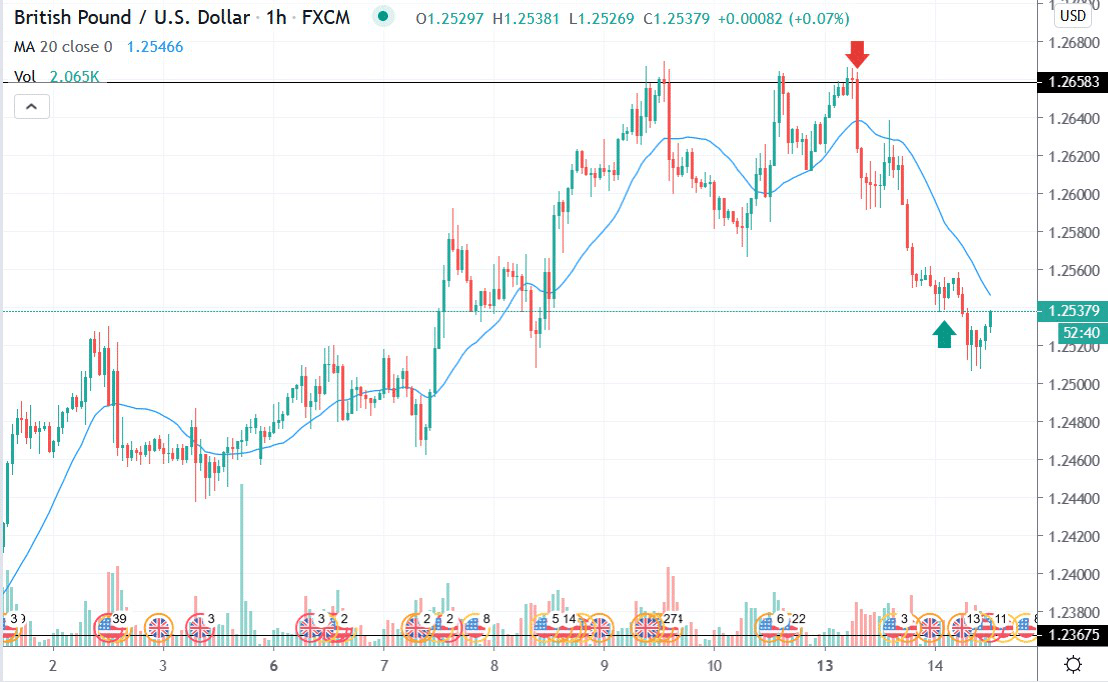
Example: Look at an example of a trading opportunity on the GBP/USD currency pair. During the analysis of the GBP/USD pair, we checked the economic calendar and learned that the UK’s National Statistics Office was set to release the GDP report on Tuesday. Technical analysis showed that GBP/USD was trading around a resistance level, and this was a low-risk trading position. Therefore, we placed a SHORT order for the GBP/USD currency pair on Monday morning after the price touched a significant resistance level and decreased.
Subsequently, the trade brought in a profit of over 100 pips, as shown in the chart below.
IN SUMMARY:
The economic calendar is an essential part of Forex trading. The Forex market is driven by most economic and financial events around the world, so every trader can improve their profits by incorporating the economic calendar into their habits and trading strategies.
Therefore, we encourage both beginners and experienced traders to use the Forex economic calendar to ensure they are not caught off guard when macroeconomic data is released.
Especially, don’t ignore the economic calendar just because you think you are a technical analysis-based trader and you don’t need fundamental analysis. Remember, the ultimate goal of trading in the market is to make a profit, and the economic calendar can help you achieve this lofty goal. Wishing you wisdom and successful trading.


