The Bearish Engulfing candlestick pattern is one of my favorite price signals, as I find it more useful than some other candlestick patterns. In this article, I will explain in detail the Bearish Engulfing pattern as well as share how to apply it so that you can trade it like a professional.
Contents
What is the Bearish Engulfing Candlestick Pattern?
The Bearish Engulfing candlestick pattern, is a Japanese candlestick reversal pattern that appears at the end of an uptrend. It consists of 2 candles, the first being a bullish candle, and the second being a bearish candle that completely engulfs the body of the first candle.
Characteristics and Significance of the Bearish Engulfing Candlestick Pattern
To accurately identify the Bearish Engulfing pattern, see the image below:
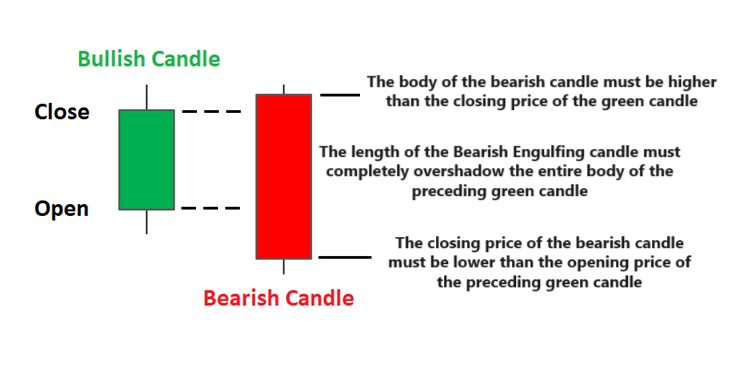
Characteristics of the Bearish Engulfing Pattern:
- The first candle is a bullish candle (green or white).
- The second candle is a bearish candle (red or black).
- The body of the second candle completely covers the body of the first candle. (Meaning the closing price of the second candle < the opening price of the first candle, and the opening price of the second candle > the closing price of the first candle).
Significance of the Bearish Engulfing Pattern:
- In the first candle, strong buying forces the closing price to be higher (price increase).
- In the second candle, sellers seeing the price rise begin to sell to take profits, causing the price to be pushed down. By the end of the session, sellers were stronger than buyers, causing the price to drop significantly.
In essence, the Bearish Engulfing pattern tells you that sellers have overwhelmed buyers and are currently in control.
Notes on Trading with the Bearish Engulfing Pattern
Many traders, upon spotting the Bearish Engulfing pattern, look to short sell in the market because they think the Bearish Engulfing pattern signals that the market is about to reverse and prices will go lower.
Mistake!
While it’s true that the Bearish Engulfing pattern shows strong selling, it does not necessarily mean that prices are about to reverse downwards.
Why?
Because in an uptrend, prices are likely to continue higher and not reverse when a bearish reversal candlestick pattern appears.
Think about it, an uptrend can last a week, a month, even a year. So do you think it will reverse just because your Bearish Engulfing candlestick appears?
Here’s an example for better understanding:
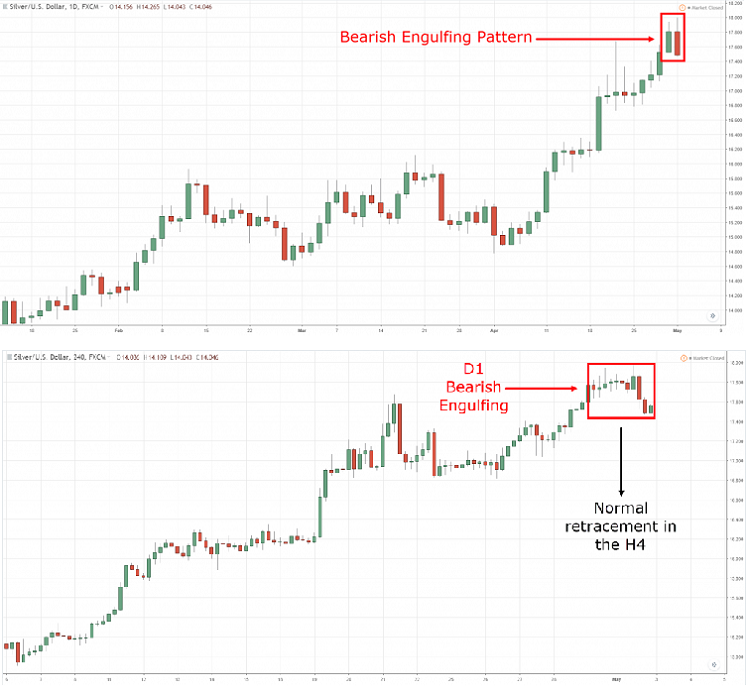
If you look at a smaller time frame, the Bearish Engulfing pattern sometimes is just a retracement of the uptrend.
This doesn’t mean Bearish Engulfing is ineffective, but what I want you to note is: to know where the market is heading, pay attention to the trend, not just the candlestick pattern.
How to Trade with the Bearish Engulfing Candlestick Pattern
Now you might be wondering, so how to effectively use the Bearish Engulfing candlestick pattern?
If Bearish Engulfing exists alone, the pattern seems somewhat meaningless, as it only reflects a short-term bearish reversal, without certainty that prices will reverse in a downtrend.
However, if you combine it with some technical indicators and the following tips – then it really shines:
Bearish Engulfing and Resistance & Support
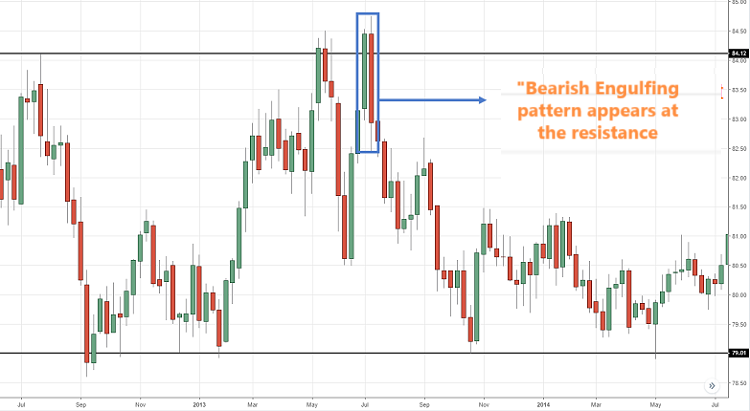
First, you need to determine that the Bearish Engulfing pattern is occurring in an uptrend. Then, if it appears at a resistance level, the percentage of reversal is very high.
Because, when the market recovers strongly and reaches a resistance level, many traders will think, “The market is very optimistic. Let me buy now and make easy profits!”
Next, the Bearish Engulfing pattern appears, implying that there will be a time when the price goes down. If the price reverses 180 degrees at the high, it indicates that many traders are ‘trapped.’ And if the price continues lower, it will trigger their stop-loss orders, further driving selling pressure.
Here is an example:
Bearish Engulfing and Moving Average (MA)
In a prolonged downtrend, the market tends to stay below the 50-day Moving Average (MA).
Therefore, any retracement towards the MA50 represents a short-term reversal opportunity.
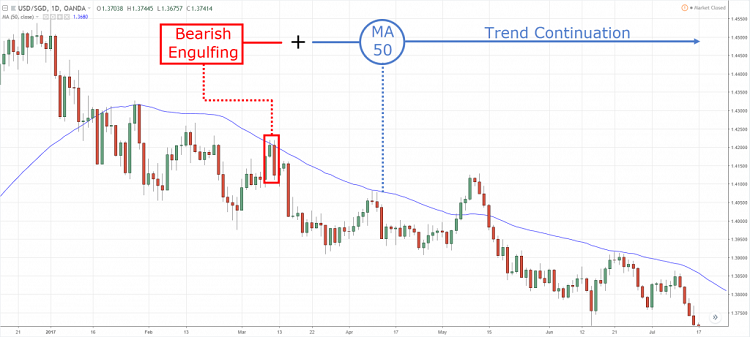
Here’s what you need to do:
- Identify a trend with the price aligning with the MA50
- Wait for a pullback towards the MA50
- Monitor the Bearish Engulfing pattern combined with the MA50 for opportunities.
Note: This technique can also be applied to a strongly downtrending market, in which case use the MA20.
Experience:
When trading with the Bearish Engulfing – a bearish engulfing pattern, you need to determine three things:
- What level has the price approached?
- Is the price rejection strong or weak?
- What is the market structure in a lower time frame?
Comparing the Sizes of the Two Candles in the Bearish Engulfing Pattern
Comparing the size of the second candle to the first is extremely important. Because the second candle will show the extent of price rejection.
Specifically, even if the second candle engulfs the first, but its size does not vary significantly, it indicates low price rejection, and the sellers are not strong enough to push the price further down, so the price is likely to rise again.
Look at the example below, and you will understand more about what I mean:
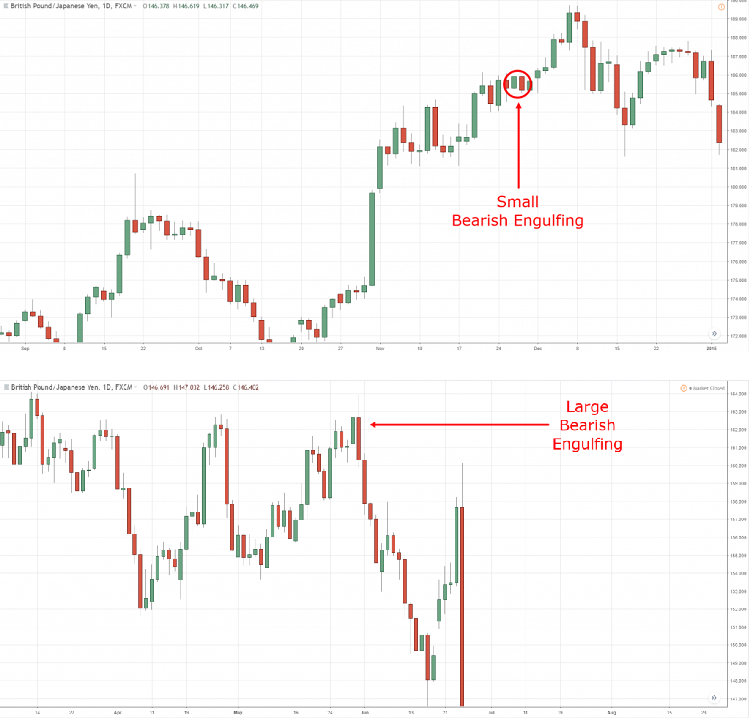
Do you see the difference? If the market shows a strong price rejection, then the likelihood of a bearish reversal is very high.
In summary:
When trading with the Bearish Engulfing pattern – a bearish engulfing candlestick pattern, always ask yourself:
-
What is the current trend of the market, bullish or bearish, and if bullish, is it a strong or weak rise, long-term or short-term?
-
Pay attention to the second candle in the Bearish Engulfing pattern to see if it is large or small, to determine whether the price rejection is strong or weak.
-
How does the market structure differ in the time frame you are looking at and in shorter time frames?
-
Where does the Bearish Engulfing pattern lie in relation to resistance and support levels, and in relation to the Moving Averages M50, M20?
I assure you that if you can answer all four points above, you will have the confidence to trade the Bearish Engulfing pattern like a professional investor.
You may be interested in: Bullish Engulfing Candlestick Pattern
The Bearish Engulfing candlestick pattern – a bearish engulfing pattern is a reversal pattern that tells you the sellers are in control, but it does not guarantee that the next trend will definitely reverse, so be very cautious when trading to avoid traps. I wish you always wise and successful in trading.


