The Bullish Engulfing candlestick pattern is known as a strong reversal signal in technical analysis. However, this pattern is often used incorrectly by many traders due to a lack of understanding of its nature. In this article, we will explore what the Bullish Engulfing candlestick pattern is, its characteristics, and what to keep in mind when using it, so you can apply it most effectively.
Contents
What is Bullish Engulfing Candlestick Pattern?
The Bullish Engulfing candlestick pattern is a Japanese candlestick pattern signaling a bullish reversal, occurring at the end of a downtrend. It consists of 2 candles, the first one being a bearish candle, and the second a bullish candle (green or white) that completely engulfs the body of the first candle.
Characteristics and Significance of the Bullish Engulfing Pattern
To easily recognize the Bullish Engulfing pattern, you can refer to the image below:
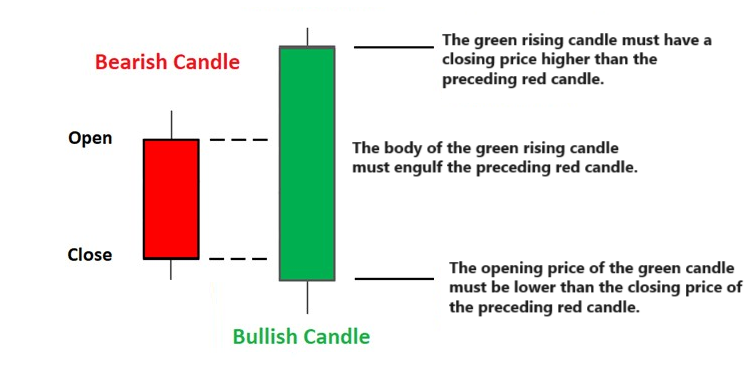
- The first candle is a bearish candle (red or black).
- The second candle is a bullish candle (green or white).
- The body of the second candle ‘engulfs’ the entire body of the first candle. (Meaning the closing price of the second candle > the opening price of the first candle, and the opening price of the second candle < the closing price of the first candle).
Significance of the Bullish Engulfing Candlestick Pattern:
- In the first candle, strong selling forces the price lower.
- In the second candle, buyers seeing the low price enter the market, overpowering sellers, pushing the price higher.
Note that with the Bullish Engulfing pattern, when trading, you do not need to pay too much attention to the candle’s wick (tail), but focus more on the candle’s body (closing and opening prices).
Bullish Engulfing and Hammer are Similar
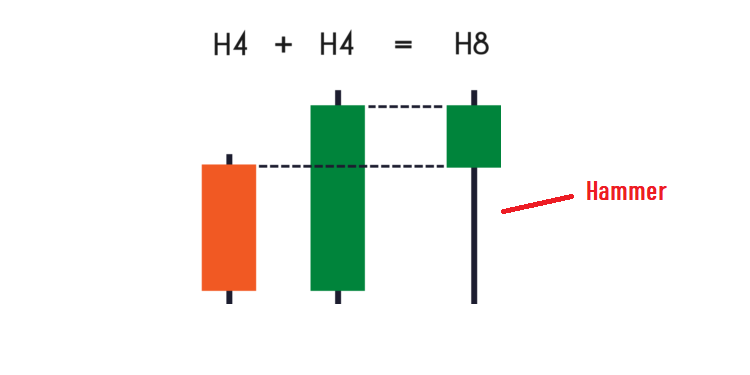
After practicing with Japanese candlestick patterns for a while, I have realized that the Bullish Engulfing and Hammer patterns are fundamentally the same and can be considered as one. It all depends on the time frame you are viewing the chart.
Why is that so, let me explain to you: On a 2-hour time frame, it will show the Bullish Engulfing pattern, but if you change the time frame to 4 hours, it becomes a hammer candle.
See the illustration below, you will understand:
Fundamentally, both these candlestick patterns indicate that buyers are stronger than sellers, pushing the price higher. But whether buyers continue to dominate and drive the price higher depends on the market context.
Considerations When Trading with the Bullish Engulfing Candlestick Pattern
Japanese candlestick patterns, to be effective, must be traded in the context of the market, and Bullish Engulfing is no exception.
When using this bullish engulfing Candlestick pattern, always remember that it is a ‘bullish reversal signal,’ so make sure it appears at the end of a downtrend.
But, nothing is certain with this pattern.
Because in many cases, some traders, seeing a Bullish Engulfing pattern appear in a downtrend, immediately think, ‘Sign of a price increase, let’s buy now.’ But in the end, the market continues to decline, and they suffer losses.
For example, the image below is a chart in a 1-day time frame:
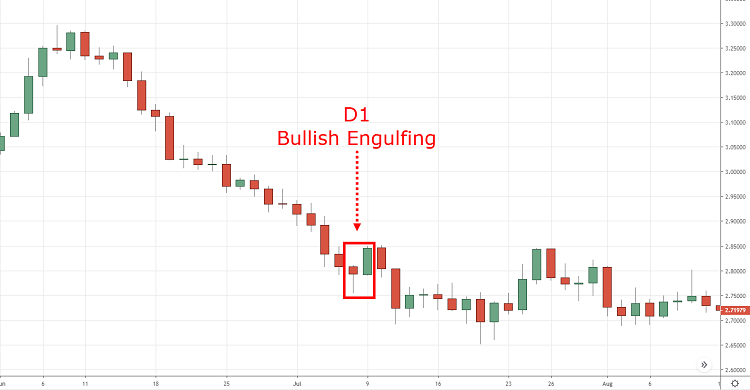
You will see the Bullish Engulfing pattern appear, but the price still follows a downward trend, right? Although there is a slight price increase, the buying power is only dominant for a moment, and then sellers overpower and push the price lower.
Still the same chart, but if you choose a smaller time frame, you will see that this is actually a retracement. (counter price movement of the current trend, but then it returns to the original trend)
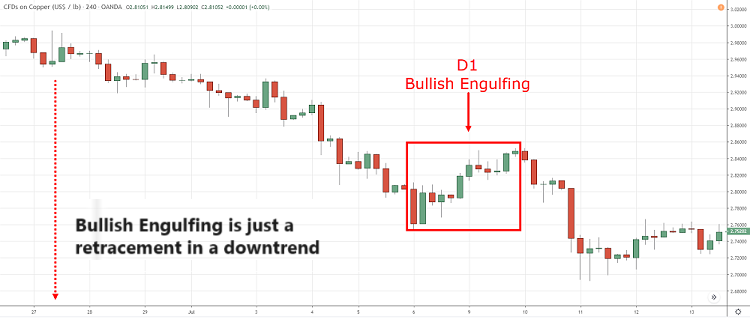
You get the point, right? What I mean is if Bullish Engulfing appears in a long-term downtrend, then its appearance only causes a temporary price increase, and then the price follows the old trend, thus, Bullish Engulfing may not become a reversal signal.
How to Trade with the Bullish Engulfing Pattern
So how should you trade with the Bullish Engulfing pattern? The first thing you must determine is the current market trend, whether it is bullish or bearish. If it is bearish, it meets the requirements of the pattern (but if it is a long-term downtrend, consider and choose to monitor the pattern in a very small time frame).
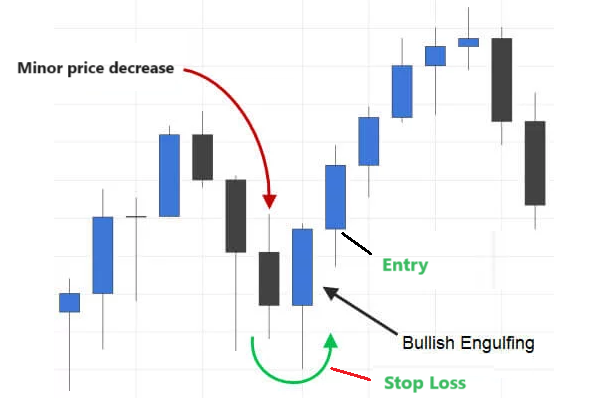
In the image above, you will see a small price drop, followed by a bullish engulfing candlestick pattern. You can place a buy order right after the close of the engulfing candle. And place your stop-loss order at the lower end of this candlestick.
Additionally, to trade successfully, don’t overlook the following considerations:
-
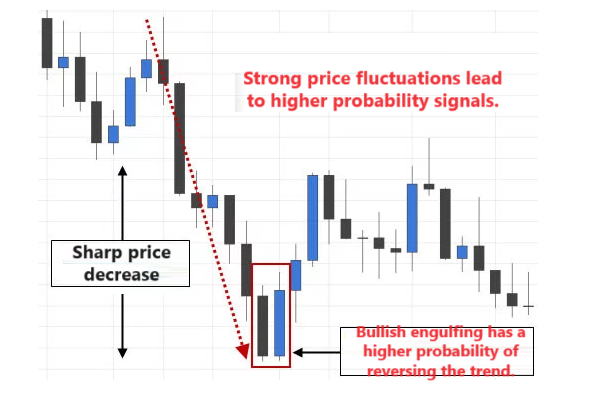
Trading with the Bullish Engulfing Candlestick pattern is more effective (higher accuracy rate) when it follows a strong price drop.
-
Pay attention to the size of the engulfing candle compared to the previous candle. The larger candle 2 is than candle 1, the higher the probability of reversal. If it engulfs even the wick of candle 1, the signal is even stronger.
-
As I analyzed above, although it is a reversal pattern, it is only reliable in the short term, and there is no guarantee that the price will continue to move in the direction indicated by the signal.
-
If the engulfing pattern is breaking out of the support or resistance levels, the reversal signal is stronger.
-
Just like other Japanese candlestick patterns, when considering the Bullish Engulfing pattern, it is also necessary to combine it with other technical indicators to increase its effectiveness.
Above are our guidelines on the Bullish Engulfing candlestick pattern – a bullish engulfing pattern. The Bullish Engulfing pattern can help you earn profits if you understand it well and know how to combine it with other indicators for analysis. Practice regularly to be able to use it proficiently. Wishing you successful trading.


