The Consumer Price Index (CPI) is a crucial economic indicator that plays a pivotal role in understanding the dynamics of inflation and its impact on the economy. In this article, we will find what is CPI, explore how it is calculated, and examine its significant influence on various aspects of the economy. Whether you’re an economist, a business owner, or simply someone interested in financial matters, understanding CPI is essential in comprehending the economic landscape. Let’s embark on a journey to unravel the mysteries of CPI and its far-reaching implications.
Contents
What is CPI? How to calculate?
What is Consumer Price Index or CPI?
What is CPI used for? Impact of its on the Economy
The Consumer Price Index is a versatile economic indicator with various uses and applications. Here’s a detailed analysis of its primary uses:
Inflation Measurement and Monetary Policy:
The Consumer Price Index (CPI) is predominantly employed to assess inflation or deflation. Central banks, like the Federal Reserve in the U.S., depend on CPI figures to formulate their monetary policy. In scenarios where the CPI points to increasing inflation, a central bank might contemplate hiking interest rates to temper economic growth. On the other hand, if the CPI suggests deflation or minimal inflation, central banks might reduce interest rates to encourage economic growth.
Wage and Benefit Adjustments:
Many labor contracts and government programs are tied to Consumer Price Index. Workers’ wages, pensions, and social security benefits are often adjusted based on changes in CPI. This ensures that individuals’ purchasing power remains relatively stable in the face of rising prices.
Cost-of-Living Adjustments (COLAs):
COLAs are automatic adjustments made to certain payments, such as retirement benefits, based on changes in CPI. These adjustments help retirees and beneficiaries maintain their standard of living as the cost of living increases.
Investment Decision-Making:
Investors use CPI data to make informed decisions about their portfolios. High inflation erodes the real value of investments, so investors may seek assets like stocks, real estate, or commodities as hedges against inflation. Understanding CPI trends is crucial for asset allocation strategies.
Economic Forecasting:
Economists and analysts use CPI data as an important component in their economic forecasting models. It helps them predict future inflation rates and make more accurate projections for economic growth and stability.
Budgeting and Financial Planning:
Households and businesses use CPI data to budget and plan for the future. It allows them to anticipate changes in the cost of goods and services and adjust their financial plans accordingly.
Policy Formulation:
Governments use CPI data to inform various policy decisions. It helps in setting tax brackets, social program eligibility criteria, and other economic policies.
Cross-Country Comparisons:
CPI is used for international comparisons of price levels and inflation rates. It provides a common metric for evaluating economic conditions and standard of living in different countries.
Market Research and Pricing Strategies:
Businesses use CPI data to analyze consumer price trends and make pricing decisions. Understanding how prices change over time can help companies set competitive prices and adapt their product offerings.
Real GDP Calculation:
CPI is also used in the calculation of the Real Gross Domestic Product (GDP), which adjusts nominal GDP for inflation. Real GDP provides a more accurate measure of an economy’s actual output by accounting for changes in price levels.
How to calculate CPI?
The Consumer Price Index (CPI) is calculated through a multi-step process that involves collecting price data for a basket of goods and services and then comparing those prices over time. Here’s a simplified explanation of how CPI is calculated:
Step 1: Select the Base Year: Choose a specific year as the “base year.” The prices in this year will serve as the reference point for all other years.
Step 2: Select the Basket of Goods and Services: Identify a representative “basket” of goods and services that an average consumer typically purchases. This basket includes items like food, clothing, housing, transportation, healthcare, entertainment, and more. The selection of items should reflect typical consumer spending patterns.
Step 3: Collect Price Data: Regularly collect price data for each item in the basket in both the base year and the current year (or other periods you want to compare). Price data is typically collected from various sources, including stores, surveys, and government agencies.
Step 4: Calculate the Cost of the Basket: Multiply the prices of each item in the basket in the current year by the quantities of those items purchased in the base year. This gives you the cost of the basket in the current year if you were to purchase the same items as in the base year.
Step 5:Calculate the Cost of the Basket in the Base Year: Similarly, calculate the cost of the basket in the base year using the prices and quantities from the base year.
Step 6:CPI Calculation: To calculate the CPI for the current year, divide the cost of the basket in the current year by the cost of the basket in the base year and multiply by 100:
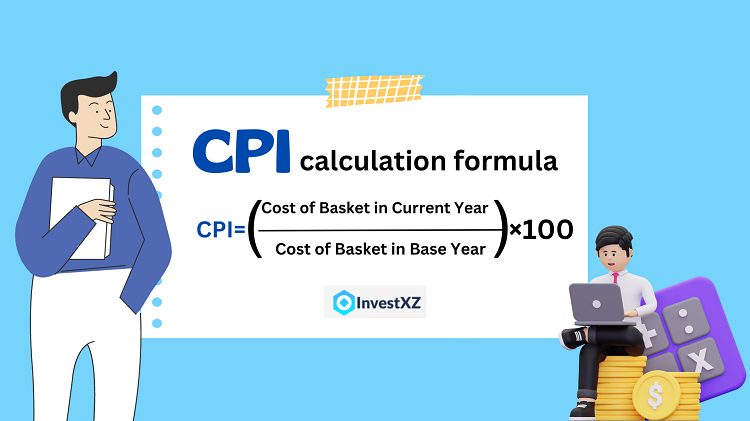
This formula expresses the CPI as a percentage relative to the base year. If the CPI is 100, it means that the cost of the basket in the current year is the same as in the base year. If the CPI is above 100, it indicates inflation, and if it’s below 100, it indicates deflation.
Let’s go through a simplified example of how to calculate the Consumer Price Index for two hypothetical years: the base year (Year 1) and the current year (Year 2). We will use a small basket of goods consisting of three items: apples, bread, and gasoline, with their respective prices and quantities.
Year 1 (Base Year):
- Apples: Price = $1 per pound, Quantity = 10 pounds
- Bread: Price = $2 per loaf, Quantity = 5 loaves
- Gasoline: Price = $3 per gallon, Quantity = 20 gallons
Year 2 (Current Year):
- Apples: Price = $1.20 per pound, Quantity = 12 pounds
- Bread: Price = $2.20 per loaf, Quantity = 6 loaves
- Gasoline: Price = $3.50 per gallon, Quantity = 18 gallons
Now, let’s calculate the CPI for Year 2 using Year 1 as the base year.
Step 1: Calculate the Cost of the Basket for Year 1 and Year 2.
For Year 1:
- Cost of Apples in Year 1 = $1 per pound * 10 pounds = $10
- Cost of Bread in Year 1 = $2 per loaf * 5 loaves = $10
- Cost of Gasoline in Year 1 = $3 per gallon * 20 gallons = $60
Total Cost of the Basket in Year 1 = $10 + $10 + $60 = $80
For Year 2:
- Cost of Apples in Year 2 = $1.20 per pound * 12 pounds = $14.40
- Cost of Bread in Year 2 = $2.20 per loaf * 6 loaves = $13.20
- Cost of Gasoline in Year 2 = $3.50 per gallon * 18 gallons = $63
Total Cost of the Basket in Year 2 = $14.40 + $13.20 + $63 = $90.60
Step 2: Calculate the CPI for Year 2 using Year 1 as the base year.
CPI = (Cost of Basket in Year 2/Cost of Basket in Year 1)×100
CPI = ($90.60/$80)×100=113.25
So, the CPI for Year 2, using Year 1 as the base year, is 113.25. This means that, on average, the prices of the items in the basket have increased by approximately 13.25% from Year 1 to Year 2.
This is a simplified example, and in practice, the Consumer Price Index involves a much larger and more diverse basket of goods and services, with adjustments for quality changes and other factors to ensure accuracy in measuring inflation.
Step 7: Repeat for Different Periods: You can repeat this process for multiple years to calculate the CPI for each year, allowing you to track changes in prices over time.
Step 8:Calculate the Inflation Rate: To calculate the inflation rate between two years, subtract the CPI of the earlier year from the Consumer Price Index of the later year, divide by the Consumer Price Index of the earlier year, and multiply by 100:
Inflation Rate = ((CPI in Later Year − CPI in Earlier Year)/CPI in Earlier Year)×100
Here’s a simple example using hypothetical CPI values for two years:
Year 1 (Base Year): CPI in Year 1 = 100
Year 2 (Later Year): CPI in Year 2 = 110
Now, let’s calculate the inflation rate for Year 2 compared to Year 1 using the following formula:
Inflation Rate = (CPI in Year 2−CPI in Year 1/CPI in Year 1)×100
Substitute the values:
Inflation Rate = ((110−100)/100)× 100% =10%
=> So, the inflation rate for Year 2 compared to Year 1 is 10%. This means that, on average, prices increased by 10% from Year 1 to Year 2.
Relationship between CPI and Inflation rate
The Consumer Price Index (CPI) and the inflation rate are closely related, but they are not the same thing. The CPI is a measure of the average change in prices of a fixed basket of goods and services over time, while the inflation rate is a percentage that represents the rate at which prices, as measured by the CPI or other inflation indices, are increasing or decreasing over a specific period.
Here’s the relationship between CPI and the inflation rate:
CPI as a Measure of Inflation:
The CPI is commonly used to measure inflation. When the CPI increases over time, it indicates that, on average, the prices of goods and services in the basket have risen, which is a sign of inflation. Conversely, when the Consumer Price Index decreases, it suggests deflation or falling prices.
Calculation of Inflation Rate:
The inflation rate is calculated based on changes in the CPI over two periods, typically a base year and a current year. It quantifies the percentage increase or decrease in prices during that time. The formula is mentioned above.
- If the inflation rate is positive, it means prices have increased, and there is inflation.
- If it’s negative, prices have decreased, indicating deflation.
- A zero inflation rate means that prices have remained constant.
CPI’s Role in Monetary Policy:
Central banks, such as the Federal Reserve in the United States, use CPI data to inform their monetary policy decisions. When CPI shows a persistent increase in prices (inflation), central banks may raise interest rates to cool down the economy. Conversely, when Consumer Price Index is too low (deflation or very low inflation), central banks may lower interest rates to stimulate economic activity.
Consumer Impact:
Changes in the CPI and the inflation rate can have significant effects on consumers. Rising inflation erodes the purchasing power of money, making goods and services more expensive. Consumers may need to allocate more of their income to cover their expenses, which can impact their standard of living.
CPI pros and cons
The Consumer Price Index (CPI) is a widely used economic indicator, but it comes with its own set of advantages and disadvantages. Here’s a summary of both:
In conclusion, while the Consumer Price Index is a valuable tool for measuring inflation and making economic decisions, it has limitations and potential biases that need to be considered. To address some of these issues, statisticians and economists continually refine the methodology and components of CPI to provide a more accurate representation of changing consumer behaviors and economic conditions.
Relationship between CPI and Unemployment
The relationship between the Consumer Price Index and unemployment is complex, as they are two distinct economic indicators that measure different aspects of an economy. However, they are interconnected through various economic factors and policy considerations. Here’s an overview of the relationship between CPI and unemployment:
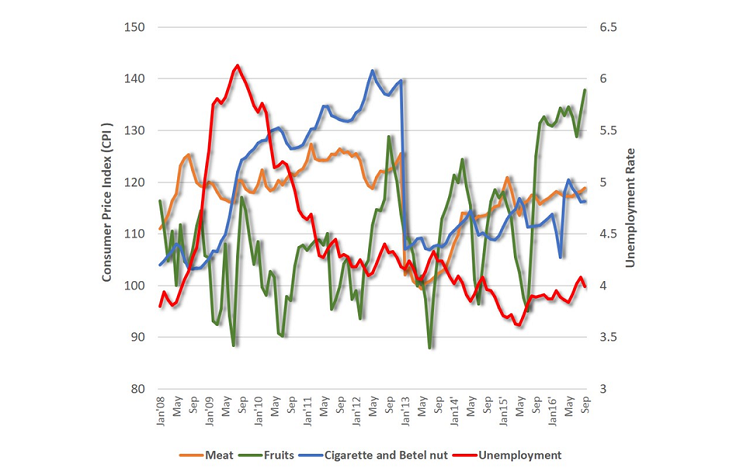
Inverse Relationship in the Phillips Curve:
The Phillips Curve is a concept in economics that suggests an inverse relationship between inflation (as measured by the CPI) and unemployment. According to the Phillips Curve, when unemployment is low, inflation tends to be higher, and vice versa. This suggests that there can be a trade-off between inflation and unemployment in the short run.
Demand-Pull Inflation and Unemployment:
When the economy is operating at or near full employment, increased demand for goods and services can lead to demand-pull inflation. As businesses struggle to meet rising demand, they may raise prices. In this situation, low unemployment can contribute to higher CPI values.
Cost-Push Inflation and Unemployment:
On the other hand, cost-push inflation can occur when factors such as rising energy prices or supply disruptions lead to increased production costs. This can result in higher prices without necessarily lowering unemployment. Cost-push inflation can be a challenge for policymakers because it can lead to a situation called “stagflation,” where both inflation and unemployment are high.
Monetary Policy and the Dual Mandate:
In many countries, central banks, like the Federal Reserve in the United States, have a dual mandate of maintaining price stability (often measured by CPI or inflation) and maximizing employment. These two goals can sometimes be in tension. To combat inflation, central banks may raise interest rates, which can slow economic growth and potentially lead to higher unemployment. Conversely, lowering interest rates can stimulate economic activity but may also contribute to inflationary pressures.
Long-Term Trends and Structural Factors:
In the long term, structural factors such as technological advancements, demographic changes, and shifts in the labor market can influence both CPI and unemployment. For example, automation and globalization can affect employment patterns and wage growth, while also influencing the prices of certain goods and services.
Policy Trade-offs:
Policymakers often face trade-offs between addressing inflation and reducing unemployment. Decisions regarding fiscal policy (government spending and taxation) and monetary policy (interest rates and money supply) can impact both Consumer Price Index and unemployment rates. Finding the right balance between these goals is a key challenge for economic policymakers.
While there is a theoretical relationship between CPI (inflation) and unemployment, it is not always straightforward or consistent. Economic conditions, policy choices, and structural factors all play a role in determining the direction and strength of this relationship. Policymakers aim to strike a balance between maintaining price stability and promoting full employment to achieve sustainable economic growth.
Related post:
In summary, the Consumer Price Index is a critical economic indicator with far-reaching impacts on various aspects of our economy. By understanding what is CPI and its definition, calculation, and its role in measuring inflation, we gain valuable insights into the ever-changing economic landscape. CPI influences wage adjustments, policy decisions, and investment strategies, making it an essential tool for individuals and policymakers alike.


