Technical indicators are very important for investors, especially for Traders. They help you gain a deeper insight into the market, making it easier for you to determine buying and selling trends, thereby formulating more effective investment strategies. Below are the basic indicators, most commonly used in technical analysis that you should refer to.
Contents
Most Common Technical Indicators for trader 2025
Moving Average Indicator – MA
This is also one of the best technical indicators that every investor should learn about. MA stands for Moving Average. MA is the line connecting all the average closing prices in N periods, where N is predetermined.
For example, if the period is 10 days, then N = 10, then there will be MA (10), meaning the line connects closing prices in 10 days.
Technical MA indicators are divided into 2 types, including:
- Simple Moving Average – SMA (or also known as MA)
- Exponential Moving Average – EMA.
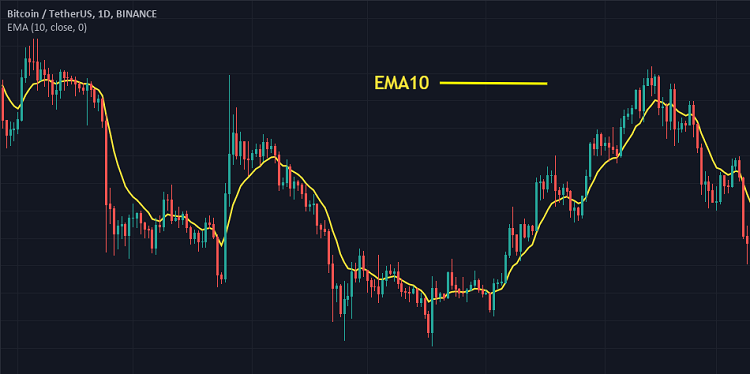
With MA indicators, you can use them as data to assess the market’s uptrend or downtrend.
For example: you open MA (100), price fluctuations are above the MA line for a long time => the market might be in an Uptrend. Conversely, if price fluctuations go down and are lower than the MA line, the market might be in a Downtrend.
Additionally, the intersection of MA lines is also used as a buying or selling signal. For example, you open MA (100) and MA (200). If MA (100) crosses below MA (200), it can be seen as a selling signal. Because when MA (100) is lower than MA (200), it means short-term price fluctuations are unlikely to increase further, hence a high probability of trend reversal.
- For details on how to use the MA line, you can refer to: What is Moving Average & secrets of the MA line in technical analysis
Relative Strength Index RSI
This is one of the most important technical indicators that anyone learning about technical analysis must know.
RSI is a momentum indicator, aimed at measuring the ‘speed’ of price movement over a period of time. RSI is displayed on a chart with values ranging from 0 – 100. Its basic principle:
- Overbought when RSI ≥ 70.
- Overbought when RSI ≥ 70.
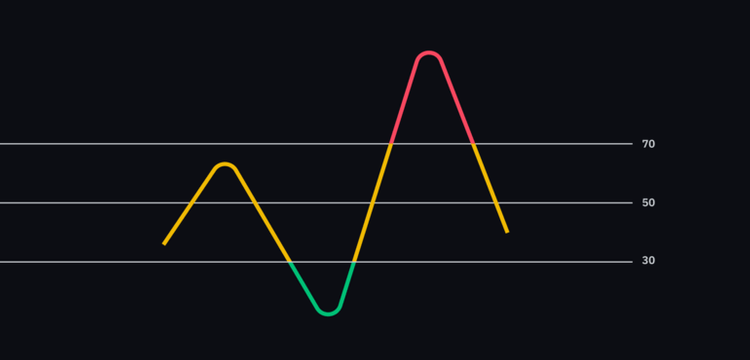
When the RSI trend is increasing, and the price fluctuation is also rising, the market is likely attracting more participants, so the price may rise sharply. Conversely, if the RSI index is going down, but the price trend is rising, then sellers may soon control the market.
RSI is not difficult to use, but many people understand it too simply, leading to wrong decisions. Below is a detailed guide on this indicator that you need to read:
Bollinger Bands Indicator
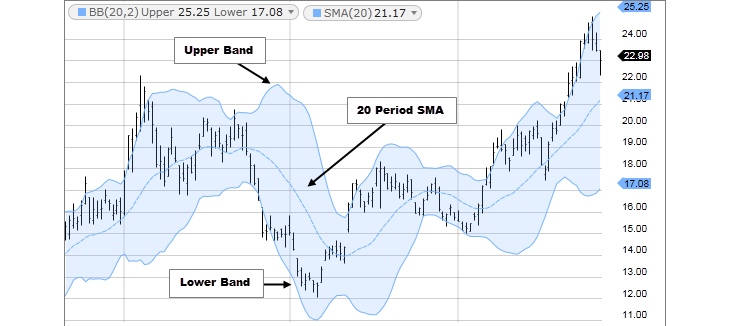
Bollinger Bands display a range of prices as they decrease and increase. When the bands are close together, there is less price fluctuation. As the bands widen, volatility increases. This technical analysis indicator is used to measure market volatility and overbought or oversold signals.
Typically, Bollinger Bands consist of three main lines: the middle SMA line, the upper BB line, and the lower BB line. These bands usually have a certain distance from each other, and this distance can change depending on whether the market volatility is increasing or decreasing.
Most traders use Bollinger Bands to wait for the price to touch the top or bottom of the band and then break back inside the band.
The center line (in the middle) is the SMA line that forms part of the Bollinger Bands indicator. When the price is above the SMA line, it tends to go up, and when the price is below the SMA line, it is falling.
Using Bollinger Bands, you can determine whether the current price is “expensive” or “cheap.”
-
If the price is near the upper Bollinger Band, it is considered “expensive” as it is higher by ~2 standard deviations than the average.
-
If the price is near the lower Bollinger Band, it is considered “cheap” as it is lower by ~2 standard deviations than the average.
However, using this technical indicator is more complicated, and it also depends on other signals.
Moving Average Convergence Divergence – MACD
MACD stands for Moving Average Convergence Divergence. This is one of the important technical indicators that helps investors track market fluctuations.
MACD consists of three components:
- MACD line: Calculated by the formula: EMA 12 – EMA 26
- Signal line: Formed from the EMA 9
- Histogram chart = MACD – Signal
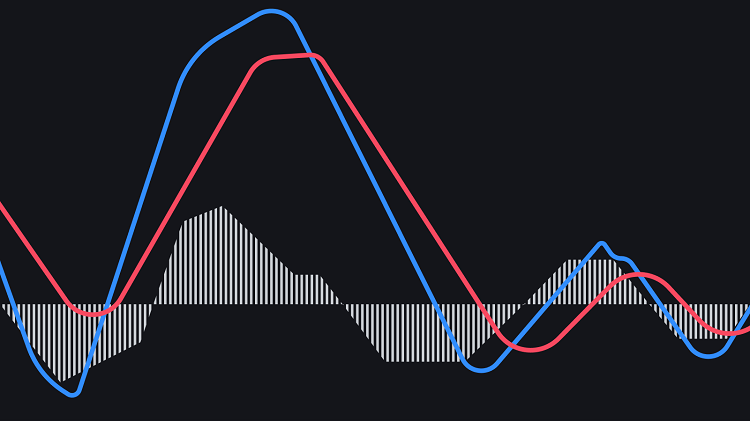
Traders use MACD to identify convergence (when the two MACD and signal lines come close together) and divergence (when the two lines move further apart). When converging, there is less volatility. When diverging, the price will either increase or decrease sharply.
MACD is a complex indicator and requires time to learn thoroughly.
Ichimoku Cloud Indicator
Like most other technical indicators, the Ichimoku Cloud measures support and resistance areas but also serves to estimate price volatility and determine market trends.
Ichimoku consists of the Moku cloud and 5 main lines:
- Tenkan-sen
- Kijun-sen
- Senkou span A
- Senkou span B
- Chikou span
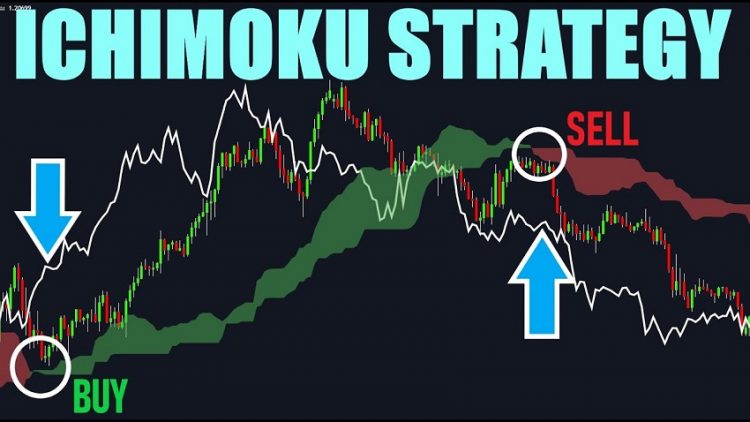
You don’t need to understand the meaning of each component. The idea is that when the price is below the cloud, it will decrease. When above the cloud, it increases in price.
Ichimoku may look complicated and cluttered on the chart, but it’s an excellent indicator for assessing the direction of trends as well as support and resistance levels.
Fibonacci Indicator
Another basic technical indicator I want to mention is Fibonacci. The Fibonacci sequence is a series of numbers: 1, 1, 2, 3, 5, 8, 13, 21, 34, 55, 89, 144… You can use this indicator to find entry points, and to determine profit-taking points.
When learning about the Fibonacci indicator, you will come across two types:
- Fibonacci Retracement: used to find BUY points.
- Fibonacci Extensions: used to find SELL points.
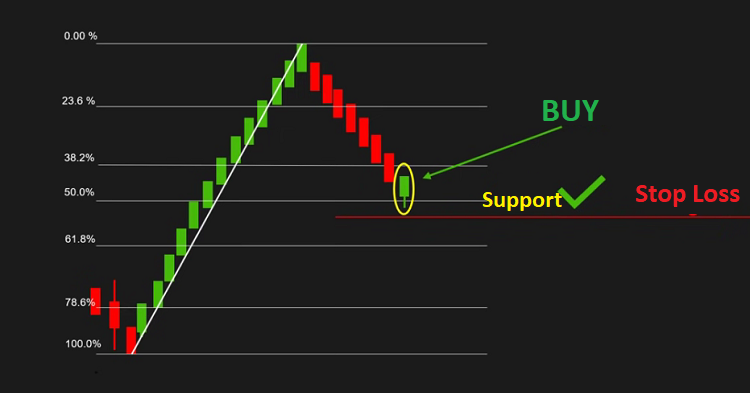
Unlike the technical analysis indicators I’ve just introduced above, Fibonacci doesn’t automatically display; you have to draw it manually between two points from the bottom to the top of the previous price increase. The screen will then show the Fibonacci retracement levels. => These are the support lines you can refer to.
Notes When Using Technical Analysis Indicators
Technical indicators can be a great supplement to your trading strategy, helping you predict price movements. Or they can also signal you to stand aside and observe when the market is quiet.
Sadly, many traders nowadays use technical indicators incorrectly, understanding them mechanically and textbook-like, and not knowing how to apply them flexibly to different markets.
If you are a beginner, you often make the following mistakes:
- Using too many indicators on the chart: Some traders’ charts look like a complex painting. Many beginners often add 4 or 5 indicators at once to ensure a higher win rate. However, this can easily lead to confusion, causing you to misinterpret the market when one indicator conflicts with another.
- Relying too much on one technical indicator: There is no technical indicator with a 100% success rate. Sometimes, you may feel that an indicator is not effective. Other times, it may provide accurate market signals.
- Changing technical indicators after a few losses: When a technical indicator seems disappointing, you might be tempted to switch to a new one. This is a common trait among new traders, but indicators are continuously changing, and none can guarantee accuracy at all times, as the market often behaves unpredictably.
=> If you notice that the technical indicator you have chosen is giving more false signals than winning ones, reconsider how you are applying the indicator. Professional traders spend years testing different indicators to find the best way to use them for evaluating trades with high probability.
For example, a technical indicator like RSI should identify overbought and oversold areas, but many traders find RSI better for identifying divergences. This is more reliable than expecting a market reversal from this indicator.
A single indicator cannot measure all the factors necessary for successful trading, but you can adjust your strategy to use the most valuable indicators. Each indicator has its unique function, and it requires time to practice and gather experience from practical application. If you are familiar with trading, you may only need 2 or 3 technical analysis indicators, as long as you understand them thoroughly.
For example: add 50EMA and 200EMA to your chart along with RSI. You could also quickly add MACD or Ichimoku Cloud as a fast way to assess trends.
Above are the most commonly used and effective technical indicators for trading that invest286.com wants to share with everyone. Hopefully, this information will help you gain more knowledge for better technical analysis, leading to more accurate and effective investment choices.


