
The Moving Average (MA) is a technical indicator that helps investors assess market trends, thus enabling the formulation of profitable investment strategies. However, understanding the essence of MA and how to use it effectively is not common knowledge. If you want to delve into the details of the Moving Average, follow us in the content below.
Contents
What is Moving Average?
The Moving Average (MA) is a line connecting the average closing prices of a stock/currency/coin over N periods, where N is predetermined..
The definition of Moving Average might seem complex and hard to visualize, but it might be clearer with an example:
– A 20-day Moving Average (MA 20) on a D1 chart is the line connecting the average closing prices of the last 20 days.
– A 30-hour Moving Average (MA 30) on an H1 chart is the line connecting the average closing prices of the last 30 hours.
How to Choose a Period for the Moving Average
When using the Moving Average in technical analysis, you can freely choose the MA period, but you should follow these rules:
- For long-term technical analysis with MA: consider using MA (100), MA (200)
- For medium-term technical analysis with MA: monitor using SMA (50)
- For short-term technical analysis with MA: use SMA (10), SMA (14), SMA (20), etc.
The number after MA represents the period, like MA (50), MA (100), MA (200),… It denotes the number of trading sessions (days), for example, 50 sessions, 100 sessions, 200 sessions…
Why is it so? Because there’s a principle:
-
The shorter the Moving Average period, the closer it sticks to the price and the more sensitive it is to price changes.
-
The larger the Moving Average period, the less it fluctuates compared to the price.
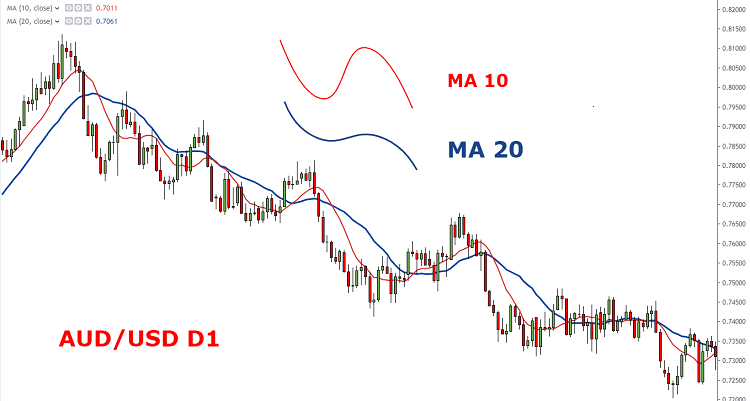
From the above image, you can see the MA 10, which has a shorter cycle but reacts more “sensitively” to the price, closely following the price, with many “sharp” bends. Meanwhile, the MA 20 runs smoother and sticks less to the price changes.
However, you should also note that:
- With too short a time cycle, having too few days to calculate the closing price results in data that is insufficient to “represent the trend,” often reflecting the trend inaccurately.
- With too long a cycle, especially over many periods of past price increases and decreases, the offsetting of increases and decreases leads to a smooth MA that becomes distant from the price line. At this point, determining the trend accurately becomes very difficult.
Therefore, it’s best to use the cycle milestones I’ve suggested above for short-term, medium-term, and long-term analysis.
What is the Significance of the Moving Average?
The Moving Average – MA is incredibly useful and has many meanings in technical analysis, specifically:
-
In the short term, price fluctuates sharply up and down, making it difficult to evaluate these movements. Therefore, the Moving Average – MA was introduced to give us an overall view of these fluctuations, helping to filter market noise and highlight the main trend.
-
The Moving Average – MA is the basis for determining the trend. For example, when the price line is above the average, it indicates an upward trend. Conversely, when the price line is below the average, it can confirm a downward trend.
-
The Moving Average is also often used as a resistance and support threshold. When the price corrects down close to the MA, it will bounce back up. Similarly, when the price moves up from below and touches the MA line, it will turn and go down.
-
Combining MAs, we can create other technical indicators, notably the MACD indicator formed by MA 9, MA 12, and MA 26 lines.
Types of Moving Averages – MA
To fully understand what is Moving Average (MA), it’s essential to know about its types and how they are formed.
Currently, there are two commonly used types of MAs: Simple Moving Average (SMA) and Exponential Moving Average (EMA).
Simple Moving Average – SMA
SMA, short for Simple Moving Average, is the simplest MA indicator, calculated as the average of prices over a specific time period.
For Example:
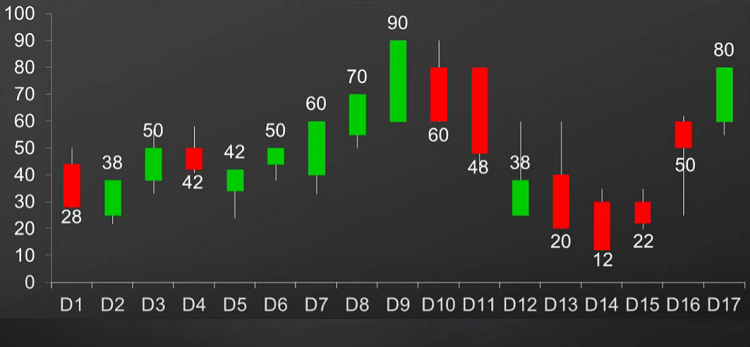
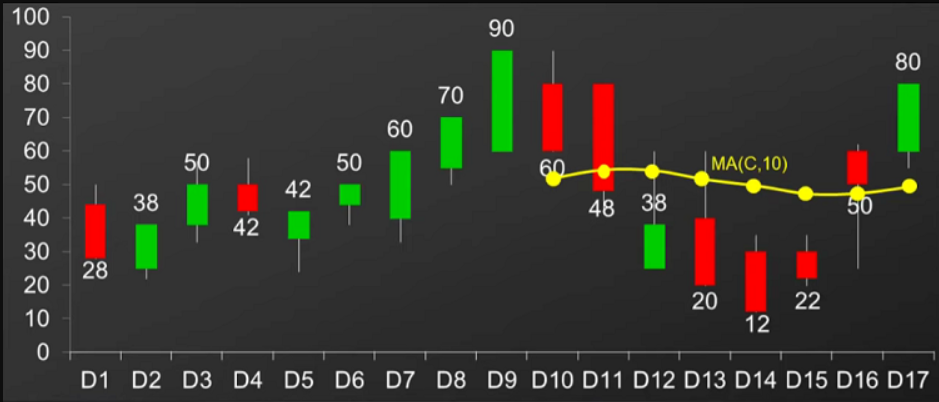
In the chart above, we have data on the closing prices for the first 10 days. To determine the SMA 10, it means you must calculate the average closing price from D1 to D10. After obtaining the result, mark that value on the D10 on the chart. See the image below:
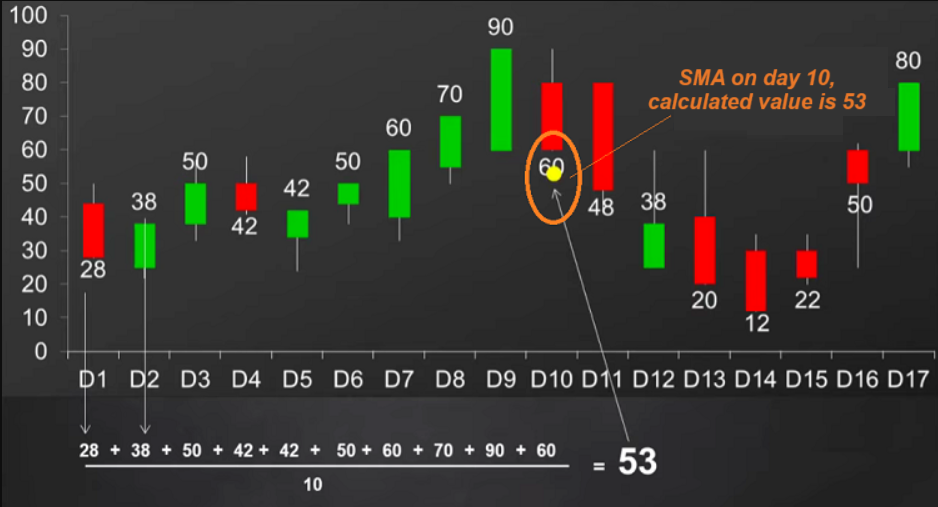
Continuing to day 11, the average value is calculated from D2 to D11, then mark that value on the chart on D11.
⇒ SMA for day D11 = (38 + 50 + 42 + 42 + 50 + 60 + 70 + 90 + 60 + 48)/100 = 55.
Do the same for other days, then connect the marked points on the chart together, and you have the SMA 10.
This method of calculating the MA is only explained so that you understand the essence of this indicator. In technical analysis applications, MA lines are pre-calculated, and you just need to set them to display for easy analysis.
- Pros: Simple, easy to use, widely applied, reacts slowly to price, thus helping to filter false signals.
- Cons: When analyzing the short-term market, the SMA is not very effective, as it is considered a slow signal, not sensitive to signals and market fluctuations.
Exponential Moving Average (EMA)
Because the Simple Moving Average (SMA) is a lagging indicator, it always follows the actual price. To reduce this lag, people use the Exponential Moving Average (EMA).
The EMA (Exponential Moving Average) is a moving average that gives more weight to recent days’ price data compared to past data.
So, what’s the difference between EMA and SMA? They differ fundamentally in the following ways:
- In SMA, the price data of each day is weighted equally.
- In EMA, the price data of each day is given different weights, with days closer having higher weights and days farther away having lower weights.
=> EMA primarily focuses on recent fluctuations and closely tracks price movements. Therefore, for short-term analysis, it responds better to the market, providing better data than SMA.
Pros: It reacts more strongly to recent market fluctuations, allowing investors to more accurately identify short-term market trends. This can help you spot unusual fluctuations that may lead to trend reversals, enabling better entry and exit decisions.
Cons: It can be overly sensitive to short-term market volatility, leading to false signals for traders at times.
There is no one-size-fits-all answer. EMA simply responds to the market faster than SMA, so it is preferred for short-term analysis..
In trading, it’s often flexible to combine both EMA and SMA. This approach helps identify trends, find short-term buying/selling points, and effectively filter false signals
How to Use Moving Average (MA)?
The Moving Average (MA) indicator is used for various purposes and is quite effective. Let’s explore how to use it for different purposes.
Using MA for Trend Trading
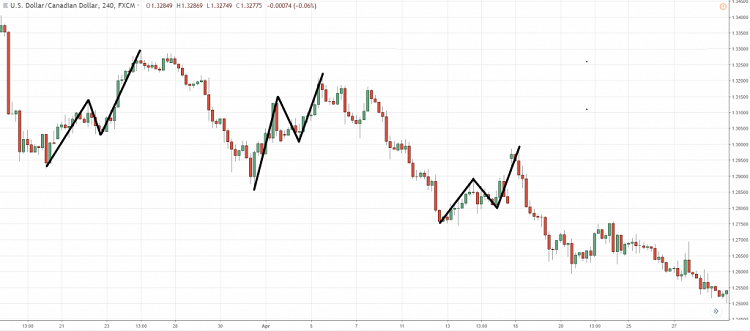
Many traders define a downtrend when subsequent highs are lower than the previous highs.
So, when a subsequent high is higher than the previous high, does that mean the downtrend has ended?
Not necessarily, as it might be just a “complex pullback.” The trend may not have ended yet. Here’s an example:
So, the question arises: how to determine the trend clearly?
The Moving Average (MA) will help you with this! Here’s how:
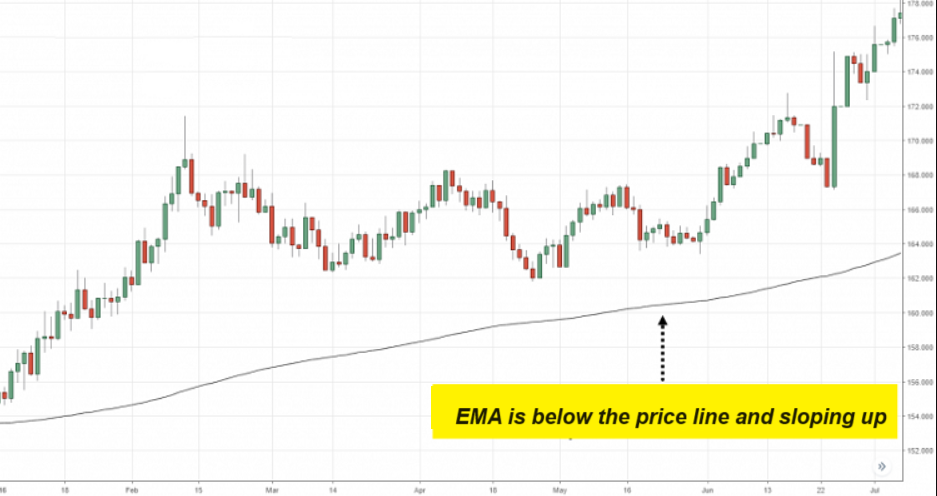
- If the price is above the EMA 200, and the EMA 200 is sloping upwards, then the market is in a long-term uptrend.
- If the price is above the EMA 20, and the EMA 20 is sloping upwards, then the market is in a short-term uptrend.
Combining Price and Moving Averages
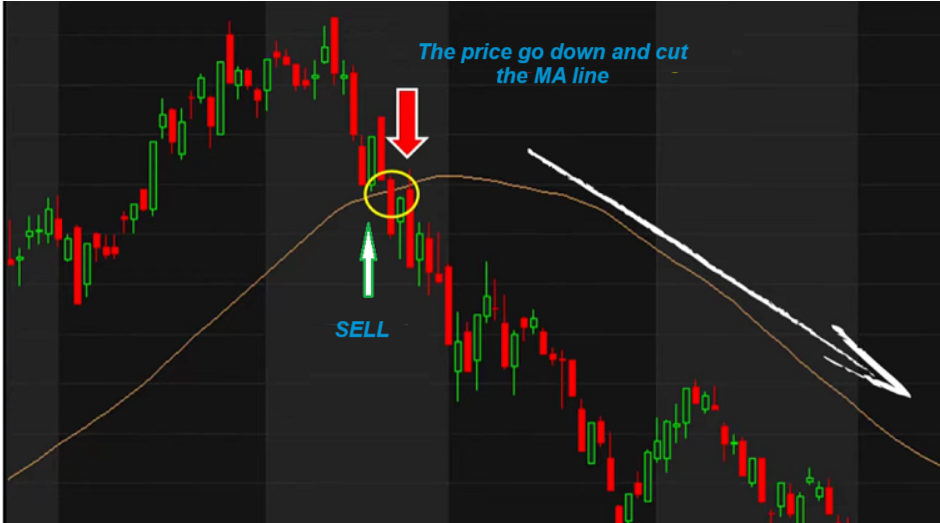
When the price crosses above the Moving Average ⇒ it’s a signal of an uptrend. => Buy when the price crosses above or when the price retraces towards the Moving Averages.
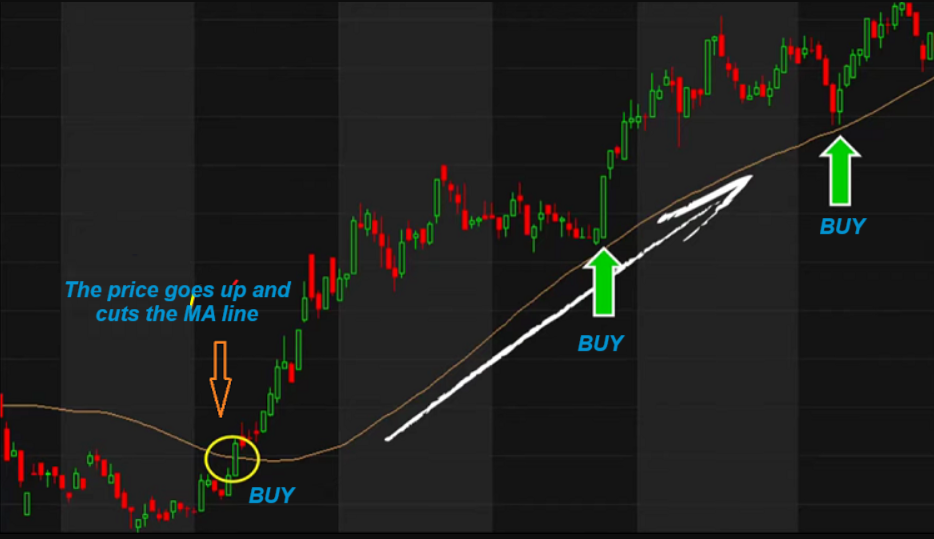
Conversely, when the price crosses below the Moving Average ⇒ it’s a signal of a downtrend. You should sell when the price crosses below or when the price retraces towards the Moving Averages.
Using Moving Averages as Dynamic Support/Resistance
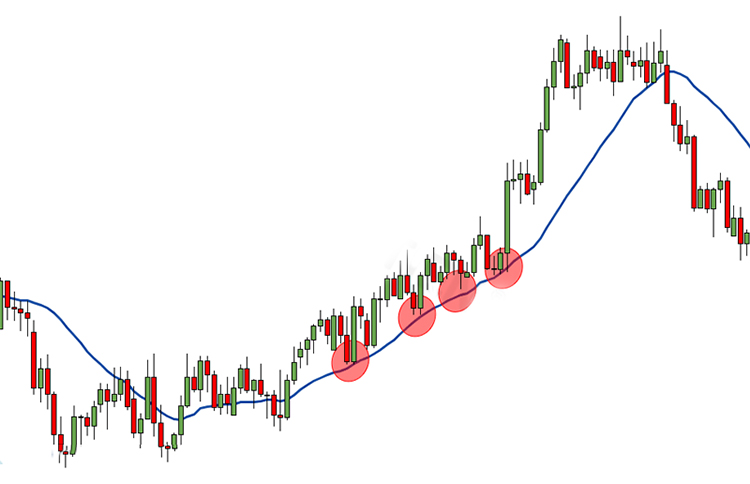
Traders can easily use Moving Averages to identify support and resistance levels. In an uptrend, the MA serves as support, while in a downtrend, it acts as resistance.
For example, in an uptrend, when the price touches and bounces off the MA, it tends to have a rebound. Only when the price breaks through the MA, there’s a high probability of a trend reversal.
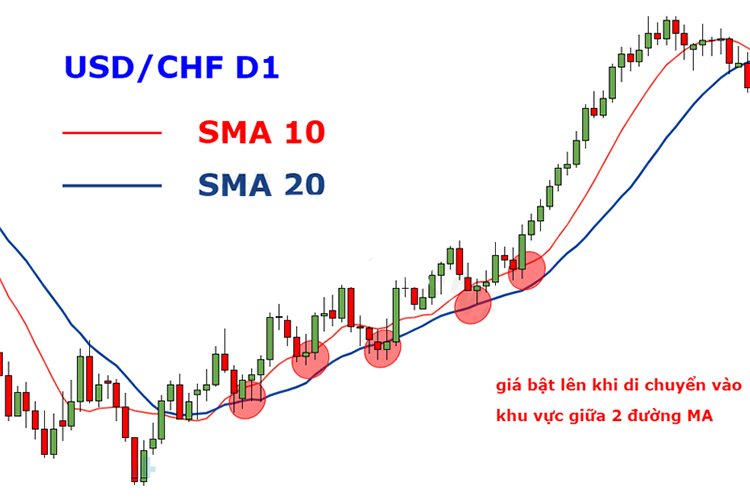
Many traders even combine two MAs, acting as support/resistance, for more accurate results. For example, using the SMA (10) and SMA (20). When the price touches and remains within these two moving averages, they tend to provide support for continuing the uptrend. Only when the price drops below the SMA 20, there’s a higher chance of a further decline.
Crossing of Moving Averages
First, you need to set up two Moving Averages with different periods, often one short-term and one long-term.
When one MA crosses another, it gives us a signal of a trend change:
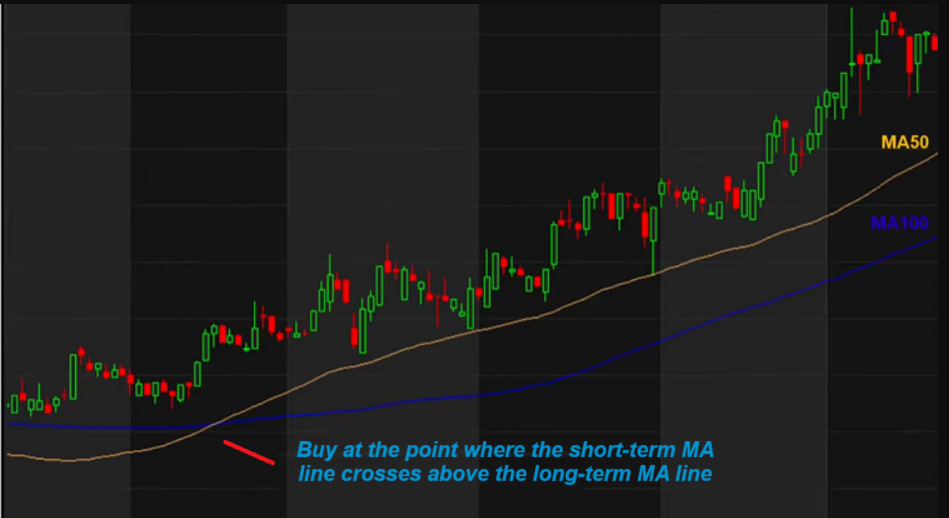
- Golden Cross: When the short-term MA crosses above the long-term MA (e.g., MA50 crosses above MA200) ⇒ Uptrend signal, consider buying at the cross or when the price touches the short-term MA.
- Death Cross: When the short-term MA crosses below the long-term MA (e.g., MA50 crosses below MA200) ⇒ Downtrend signal, consider selling as soon as possible.
Using MA for Market Selection
Here’s a question for you: if you have 100.000 USD to invest, where would you invest it? In stocks? Forex? Cryptocurrency? If you choose Forex, which currency pair would you select? Do you want to buy in a strong or weak-trending market?
I bet 99% of you would prefer to buy in a strong-trending market and prioritize selling in a strongly bearish market.
The Moving Average (MA) can also assist you in this scenario. Just remember one important note:
The steeper the MA, the stronger the trend. The flatter the MA, the weaker the trend.
Then, you only need to follow these 3 steps:
- Step 1: Choose markets within the same category. For example, if you choose Forex, compare currency pairs like AUD/USD, NZD/USD, USD/CAD, USD/JPY, EUR/USD…
- Step 2: Plot EMA 20 and EMA 50 on your chart.
- Step 3: Compare the slopes of the MA lines. The steeper the MA, the stronger the trend, and vice versa.
For example, you’ve determined that both USD/CAD and USD/JPY are in downtrends. However, USD/CAD has a steeper downward-sloping EMA, so you’d prefer to sell USD/CAD over USD/JPY because USD/CAD is in a strong bearish trend.
Trading Tips with Moving Averages – MA
It’s not complicated at all, just follow these steps:
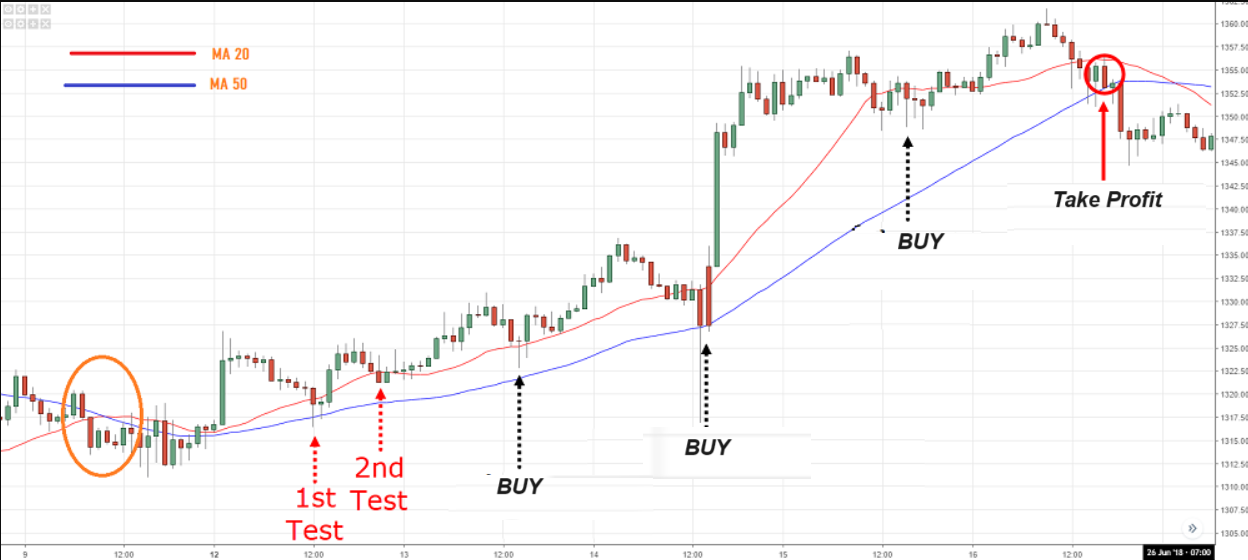
– Identify an uptrend: EMA 200 slopes upward, and the price is above the EMA.
– If it’s an uptrend, use MA 50 and MA 20, then wait for the price to test the support zone twice (meaning wait for the price to touch MA 20 and bounce back upwards twice).
– If the price tests successfully, start looking for entry points (BUY) – points where the price touches the MA 20.
– If the price follows the predicted trend, wait for it to drop and touch MA 50, then start SELLING.
See the illustrative image:
Through this article, I want you to understand the core concepts of Moving Averages (MA), which are:
-
MA is used to filter noise, making it easy to determine market trends.
-
MA serves as dynamic resistance (in downtrends) or support (in uptrends).
-
The two most common types of MA are SMA and EMA. SMA lags behind the price, while EMA is more responsive to the market.
-
Longer-term MA tends to be flatter compared to shorter-term MA.
-
The steeper the MA, the stronger the trend; the flatter the MA, the weaker the trend.
-
Combining two MAs crossing each other can help you identify trend change signals and efficient entry/exit points.
Above are all the details about the Moving Average (MA) and how to use it effectively and correctly. I hope that with this information, you can expand your knowledge in financial investment and optimize your profits. If you have any questions, please leave a comment to engage in further discussions.
Read More: What is the RSI Indicator? Guide to Using RSI for Effective Trading


