To determine market trends and appropriate buying and selling points, RSI is an important and commonly used indicator. However, what exactly RSI is, and how to apply the RSI indicator for the best results are not widely known. Therefore, let’s follow this article to update your knowledge.
Contents
What is the RSI Indicator?
RSIstands for Relative Strength Index, This indicator, invented by J.Welles Wilder, aims to measure the “speed” of price movements over a period (usually 14 days). RSI fluctuates from 0 to 100, with the value of RSI increasing as the price rises rapidly (and vice versa).
Unlike price charts or moving averages, the RSI indicator is drawn in a separate frame and is usually placed below the price frame for easy comparison.
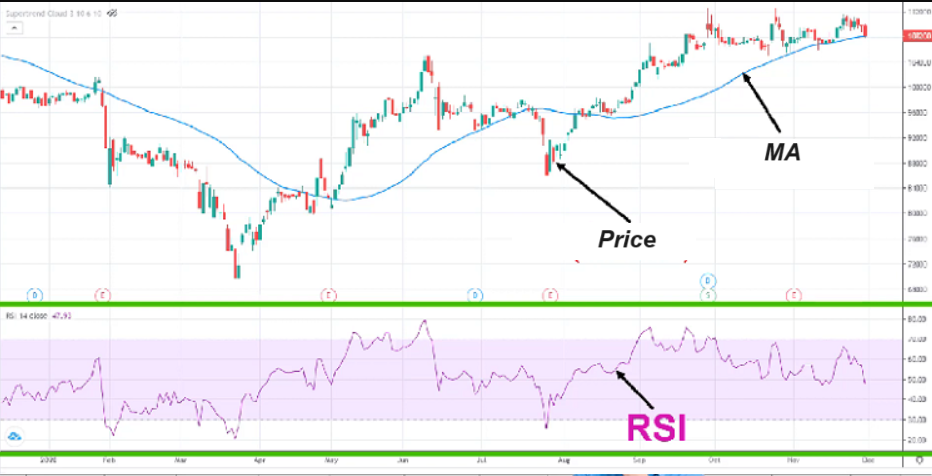
RSI fluctuates from 0 – 100, but it rarely reaches these extreme levels, typically oscillating within the 30 – 70 range. We will explain more below about why this is the case.
RSI Calculation Formula
The RSI is usually calculated over a 14-day period using the following formula:
Note:
RS (14) = Average closing price INCREASE over 14 sessions/Average closing price DECREASE over 14 sessions.
- When buying increases, causing a continuous price rise, RS increases → RSI increases.
- When selling increases, causing a continuous price drop, RS decreases → RSI decreases.
Why do we call RSI a “speed measuring” indicator? Let me explain with an example. Let’s assume we’re looking at a 10-day period for simplicity.
Suppose the stock price has increased by 100USD over the past 10 days, then the average increase of a stock per day is 10USD. Similarly, if the average decrease over 10 days is 20USD, then the stock decreases by 2USD per day on average.
Do you see how these represent the speed of the stock’s price increase/decrease?
⇒ RS = 10USD/2USD = 5.
⇒ RSI = 100 – 100/(1+5) = 83,333
What do these numbers signify? They show that the average speed of the price increase is five times greater than the average speed of the decrease. A high RSI indicates a very strong upward momentum.
When does RSI Indicator reach 100? Looking at the formula, I see it only goes up to 99 at most. RSI will hit 99 only if, in all trading sessions, the price only increases, with no decreases. Similarly, if all sessions only show price decreases, RSI will be 0.
However, such a scenario is extremely rare in the market because prices always fluctuate up and down, rarely increasing or decreasing continuously. That’s why I said RSI seldom reaches these two extreme levels.
Overbought and Oversold Zones of RSI
If you are learning what is RSI Indicator, you must have heard of the terms “overbought” and “oversold” zones associated with it.
Typically, the levels of 30 and 70 are chosen as standard benchmarks to determine if RSI is high or low.
- RSI above 70: is called the overbought zone, and there is a high likelihood of an upcoming price decrease..
- RSI below 30: RSI below 30: is called the oversold zone (Oversold), which usually indicates a downward trend and the possibility of a price correction upwards.

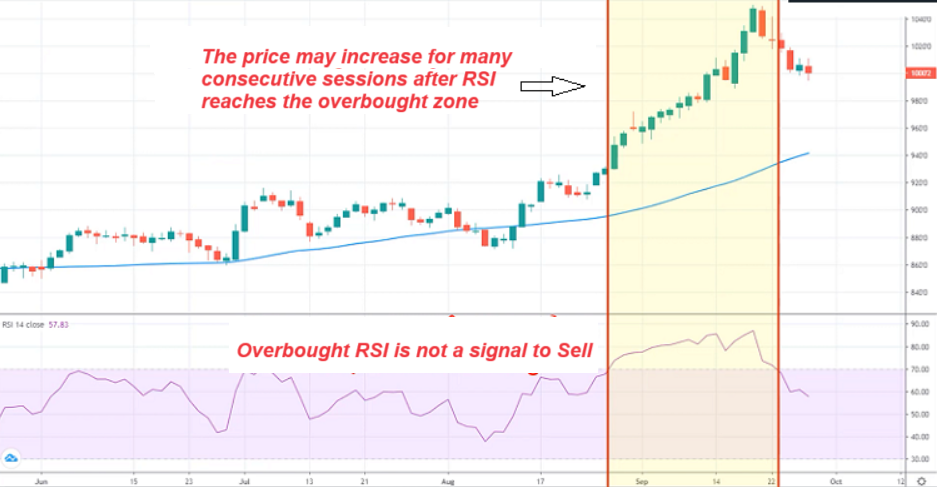
Thus, the overbought or oversold RSI zone simply uses the signal when RSI crosses the 70/30 range. However, don’t be misled by its name into thinking that you should buy when RSI touches 30, or sell when it exceeds 70.
Why is that? Let me explain with the following example:
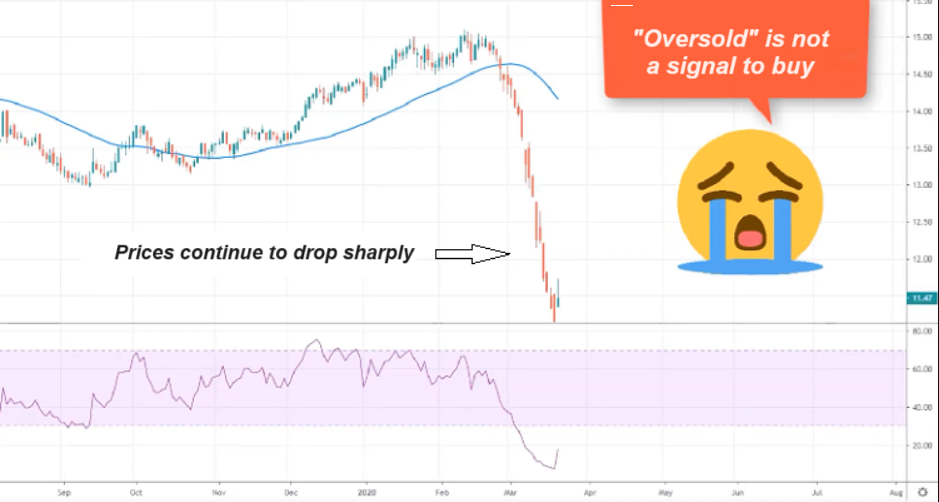
– When prices start reaching the oversold zone, many new investors, misled by the term “oversold,” think that the price has hit the bottom and start buying.
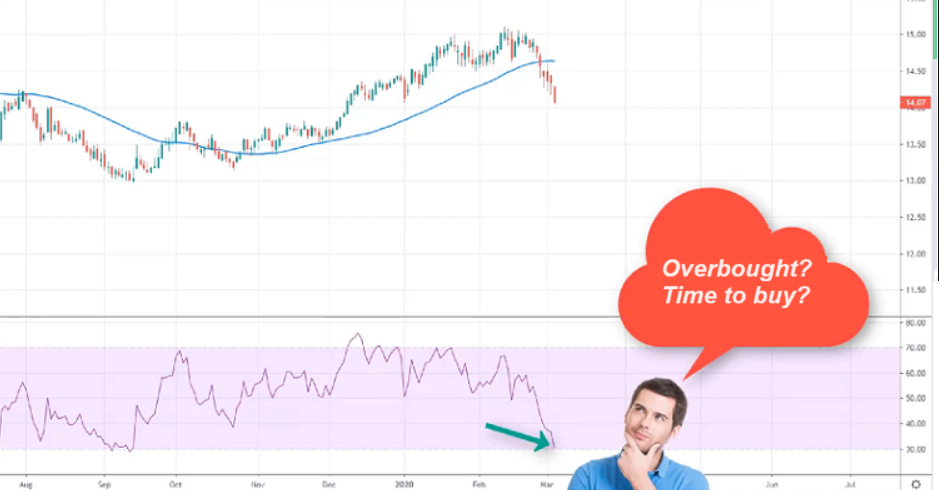
-However, that’s just the beginning of a significant price drop, and the price might continue to fall further, as RSI being oversold is not a buy signal.
– Similarly, RSI reaching the overbought zone does not indicate a sell signal, as it can stay in the overbought zone for a long time, and the price might rise significantly over consecutive sessions
RSI Indicator Trading Guide
If you’re already familiar with what is RSI indicator, the next step is learning how to apply it. RSI is actually quite straightforward to use and is not as complicated as some resources might suggest. Here is how you can trade easily with RSI.
Trading When RSI Exits Overbought/Oversold Zones
Most of the time, the RSI indicator fluctuates between 30 and 70, and during this phase, it often doesn’t signify much, leading investors to use other indicators.
However, when RSI enters the overbought and oversold zones, it attracts a lot of attention as these can be opportunities to identify trend reversals. Successfully applying RSI to identify trend reversals (also known as catching tops and bottoms) can potentially yield high profits.
Remember, do not trade when RSI touches the overbought/oversold zones (the 70 and 30 marks), but determine the moment when RSI exits these zones.
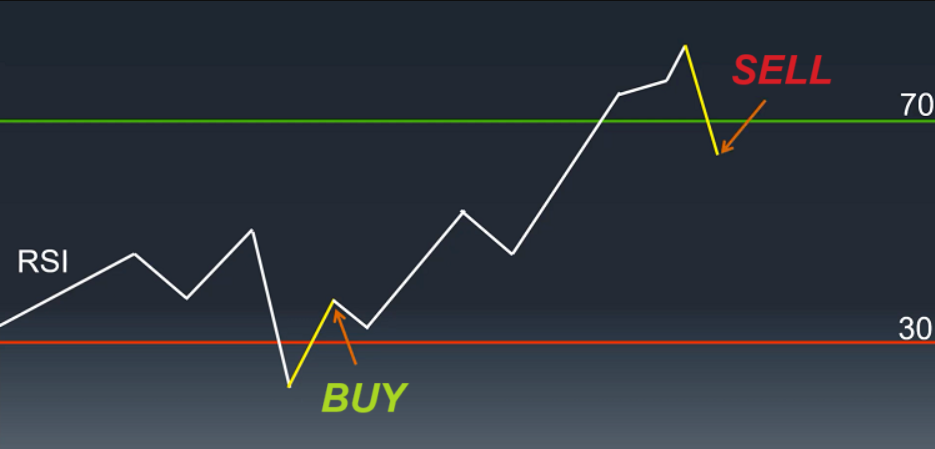
The reason why I’ve already explained and provided examples in the previous section. If you buy immediately when RSI touches the oversold zone, it’s very possible that you’ll have to watch the price decrease further in many more sessions. Similarly, if RSI just touched the overbought zone, there may still be room for an extended uptrend, and if you sell too early, you might regret it.
Using RSI Divergence Compared to Price
A much more effective approach than the one mentioned above is to use RSI divergence compared to price.
What is RSI divergence? Typically, the price line and the RSI line move in sync with each other. When the price creates a higher high compared to the previous high, the RSI also tends to do the same, forming a higher high.
However, in some cases, the RSI and price line diverge slightly, such as not creating a higher high or not forming a lower low together. This is what we call RSI divergence.
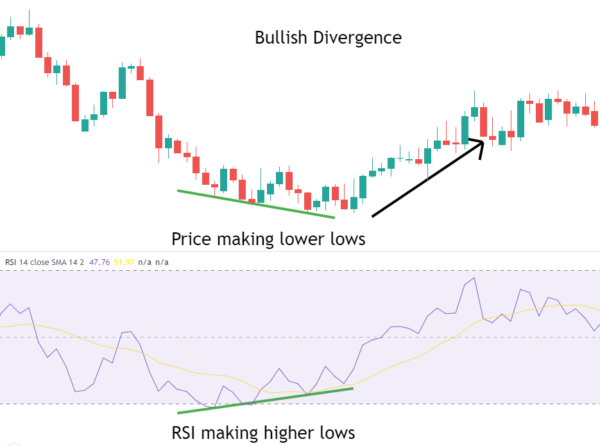
When the RSI indicator shows divergence signals, there are typically two types:
- RSI Bearish Divergence: If the price forms a higher high compared to the previous high, but the RSI forms a lower high compared to the previous high, it indicates a potential reversal to the downside in the market.
- RSI Bearish Divergence: If the price forms a lower low compared to the previous low, but the RSI forms a higher low compared to the previous low, it suggests a potential reversal to the upside in the market.
You can consider opening a sell/buy position right after confirming that the price has created the second high/low.
In addition to the regular RSI divergence mentioned above, there are hidden RSI divergences that work differently and can sometimes be confusing. Specifically:
- In an uptrend where price swings are rising, if the RSI forms a higher low compared to the previous low, even though the price’s low is higher, the uptrend is likely to continue.
- In a downtrend where price swings are falling, if the RSI forms a lower high compared to the previous high, even though the price’s high is lower, the downtrend is likely to continue strongly.
Hidden RSI divergence is a valuable tool for trend continuation analysis. You can rely on it to predict the next price movement and make well-timed buying or selling decisions.
Using the RSI Indicator to Determine Trends
Trading with the trend is a preferred approach for many traders because it has a higher success rate compared to trying to catch reversals at market bottoms or tops. So, how do you determine the trend using the RSI?
Remember that the RSI is a measure of the average gain compared to the average loss in price movements. Keep this in mind:
-
If the average gain is larger than the average loss, the market is in an uptrend.
-
If the average gain is smaller than the average loss, the market is in a downtrend.
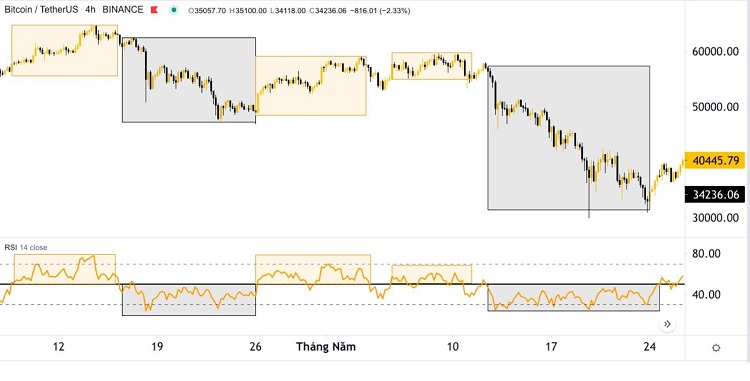
Here’s what you can do: Use higher timeframes for RSI, such as 200 or 250 (aligned with a one-year trading horizon), instead of using RSI (14), which has a shorter timeframe and may not provide a reliable trend signal.
- If RSI is above 50, indicating that the average gain is larger than the average loss, you can conclude that the market is in an uptrend, and you may look for buying opportunities.
- If RSI is below 50, indicating that the average loss is larger than the average gain, you can conclude that the market is in a downtrend, and you should be cautious about buying, possibly considering stop-loss orders if you are already in a trade.
You can see specific examples below:
Considerations when Using the RSI Indicator
While we have introduced how to apply the RSI indicator in technical analysis to find optimal buying and selling points, it’s important to keep a few things in mind:
- RSI works best in the stock market: Compared to other markets like cryptocurrencies or Forex, RSI is most effective in the stock market. This is because the stock market tends to have long-term uptrends, and pullbacks often occur in shorter timeframes. You can identify pullback opportunities and apply the RSI indicator to find highly effective buying points.
- Prioritize longer timeframes when using the RSI indicator, ideally 4 hours or daily.
- Wait for the candle to close to get an accurate closing price. Only then can you confirm whether RSI has given a buy or sell signal.
- Consider combining RSI with other signal indicators like MACD, support and resistance levels, etc., to make informed trading decisions.
- You can adjust the RSI parameters, such as changing the period from 14 days to 10 or 15, or modifying overbought and oversold levels (e.g., 80-20 or 75-25). However, it’s advisable not to change these settings too frequently and focus on mastering a particular set of parameters.
-
RSI is an indicator that measures the rate of price change and oscillates between 0 and 100. When the price rises rapidly, RSI increases, and vice versa.
-
RSI ≥ 70 is considered overbought, while RSI ≤ 30 is considered oversold.
-
Avoid blind buying/selling just because RSI is in the “overbought” or “oversold” zone, as you might end up “selling too much” or “buying too much.”
-
Prefer entering trades when RSI has just exited the overbought or oversold zone.
-
Using RSI divergence can help you identify potential price reversals or continuations.
-
You can use RSI to trade with the trend. RSI > 50 provides buying opportunities, while RSI < 50 suggests selling opportunities.
These are the key points about the RSI indicator. Hopefully, this article has provided you with a clear understanding of what RSI is and how to use it effectively. If you have any further questions, please feel free to ask in the comments below. Thank you for reading, and best of luck with your trading endeavors.


