Japanese candlestick reversal patterns are often used by traders who follow technical analysis to decide whether to enter a BUY or SELL order. Applying reversal candlestick patterns in trading helps traders earn better profits than just buying or selling based on market trends or following others’ advice. Here are the top 10 most powerful reversal candlestick patterns currently used by professional traders.
Contents
Top 10 Strongest Reversal Candlestick Patterns to Use
Reversal candlestick patterns are commonly applied by traders to analyze the rising and falling trends of the market, for example in stocks or Forex. Correctly predicting the market’s next direction allows investors to make informed decisions like buying to earn high profits or selling after a decent profit to avoid heavy losses.
Reversal candlestick patterns are divided into two types: bullish reversal patterns and bearish reversal patterns.
-
Bullish reversal patterns indicate that the price is about to turn from a decrease to an increase. It can be understood that the number of sellers is decreasing and instead, the number of buyers is starting to increase.
-
Bearish reversal patterns indicate that the price is about to turn downward. It can be interpreted as the number of sellers increasing, and the number of buyers decreasing, preventing the price from continuing to rise.
=> Bullish reversal patterns are used when a trader wants to buy, while bearish reversal patterns are used when a trader wants to sell to gain the highest possible profit.
If you do not know the features of Japanese candles such as the opening price, closing price, highest price, lowest price, candle shadows (wicks), then first review this basic information in the article What are Japanese Candles for clearer details.
Strongest Bullish Reversal Candlestick Patterns
The bullish reversal candlestick patterns to note are:
- Hammer Candle
- Inverted Hammer Candle
- Dragonfly Doji Candle
- Bullish Engulfing Candle
- Morning Star Candle
- Bullish Harami Candle
Hammer Candle
The Hammer candle is considered one of the most trusted bullish reversal candlestick patterns by professional traders. The Hammer candle has a short body, a long lower shadow that is 2 – 3 times the length of the body, and no upper shadow or a very short one. The Hammer candle usually appears at the end of a downtrend, with a long lower shadow or wick indicating that initially, selling pressure was dominant, pushing prices down, but then buying increased, making the opening and closing prices not vary much.
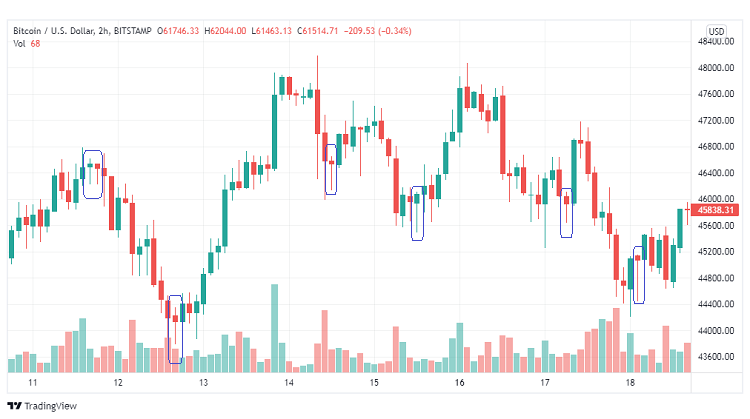
In the example above, you can also see many Hammer candles appearing frequently and continuously. Among them, many Hammer candles appear at the end of the downtrend and then the price increases as you see.
The Hammer candle, whether red or green, both indicate that buying power is increasing and signal a strong trend reversal. However, if comparing the two candles, the green Hammer candle shows that the buying side is slightly more dominant, hence the closing price is higher than the opening price.
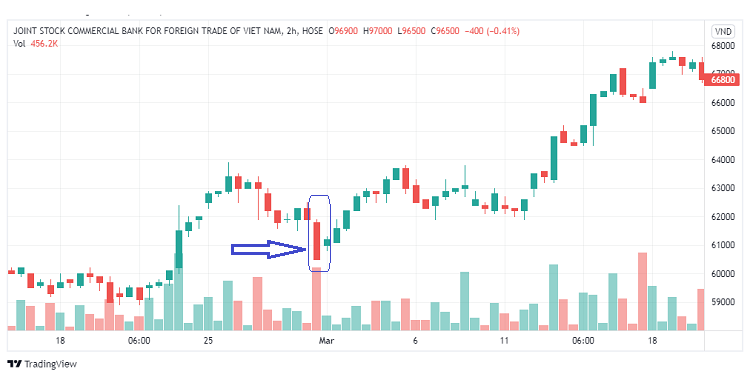
Inverted Hammer Candle
Contrary to the Hammer candle, the Inverted Hammer will have a long upper shadow, a still short body, and a very short or non-existent lower wick. The Inverted Hammer candle is used to describe the fierce tug-of-war between buyers and sellers at the beginning, with buyers initially dominating and pushing the price up, but then sellers also increasing pressure, causing the closing price to be close to the opening price.
On the other hand, the short lower wick indicates that during the session, the sellers could not exert too much pressure on the buyers, so the price could not drop too deep. Meanwhile, buyers were at times significantly dominant in pushing the price higher.
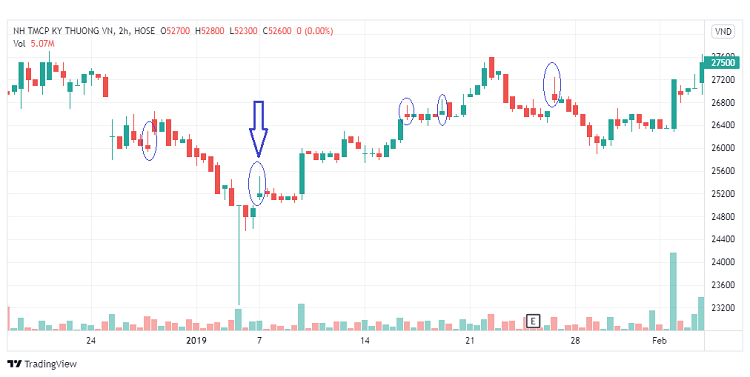
The example above is the price chart of Techcombank’s stock, where many Inverted Hammer candles appear. In the figure, the Inverted Hammer candle pointed out by the arrow is a reversal candle at the end of a downtrend, after which the price increased significantly. After it, there are other Inverted Hammer candles and the uptrend continues. However, not every appearance of the Inverted Hammer candle leads to a price increase; there are cases where it is the start of an uptrend, but there are also opposite cases as seen in the last circled Inverted Hammer candle.
Dragonfly Doji Candlestick Pattern
The Dragonfly Doji candlestick pattern is quite similar to the Hammer candle, the only difference is that in this reversal pattern, the opening and closing prices are equal. The formation of the Dragonfly Doji also starts when the sellers initially outnumber buyers and push the price down, but later the number of buyers increases, making the closing price equal the opening price.
The appearance of the Dragonfly Doji candlestick at the end of a downtrend is a signal for an upcoming bullish reversal.
Below is an example of the Dragonfly Doji candlestick appearing at the bottom of a downtrend in the EUR/USD pair, after which the price direction changed to an increase.

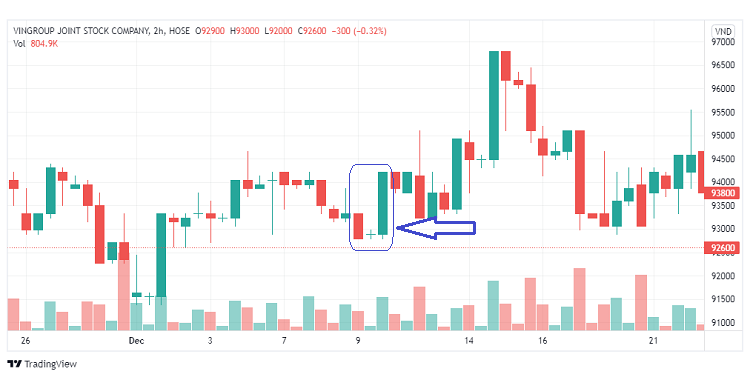
Bullish Engulfing Candlestick Pattern
The Bullish Engulfing candlestick pattern is a two-candle pattern, unlike the three single candle patterns above.
In this dual-candle pattern, you will see the first candle as a long red body followed by a second candle, a longer green body than the first red candle.
The appearance of this pattern indicates that initially, the selling force was high, causing the price to drop significantly, but later, the number of buyers increased, causing the price to rise again.
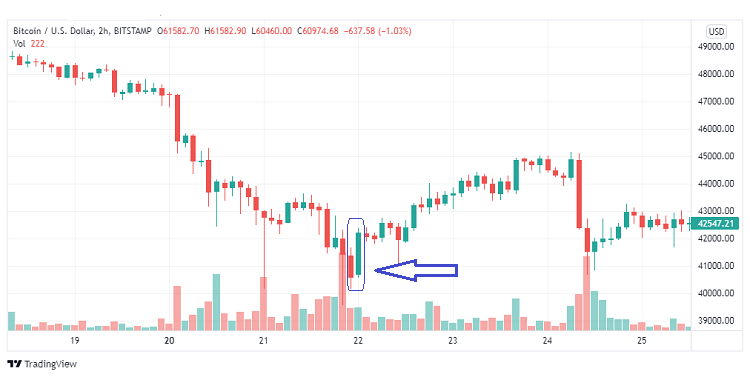
An interesting point about this pattern is that in a longer time frame, the Bullish Engulfing pattern turns into a Hammer candlestick pattern. For example, in a 1-hour frame, it is a Bullish Engulfing pattern, but in a 2-hour frame, it turns into a Hammer pattern.
Morning Star Candlestick Pattern
The next bullish reversal candlestick pattern that experienced traders often use is the Morning Star pattern. The Morning Star pattern is a three-candle pattern consisting of:
-
The first candle is a long-bodied declining candle (red or black) indicating that prices are being pushed down.
-
The second candle is a small-bodied candle or may not have a body at all, such as a Doji candle, Hammer candle, or Inverted Hammer candle. The appearance of the second candle shows that the price has almost balanced and neither side is dominant.
-
The third candle is a long-bodied increasing candle (green or white), with the closing price at least 50% higher than the closing price of the first candle in terms of the length of the first candle’s body. The longer the third candle, the stronger the reversal.
Bullish Harami Candlestick Pattern
Compared to the bullish reversal patterns mentioned above, the Bullish Harami pattern does not signal as strong a reversal, but it is also a pattern to be noted.
The Bullish Harami pattern is a double candlestick pattern, consisting of one long-bodied red mother candle and one short-bodied green child candle, only equal to or smaller than 25% of the mother candle’s body. In this pattern, the body of the child candle lies entirely within the body of the mother candle.
The Bullish Harami pattern indicates that the initial price trend was strongly decreasing due to the sellers dominating, but then the appearance of the child candle shows that the buyers are gradually recovering. Although it cannot yet raise the price back to the opening price of the mother candle, the price has turned from decreasing to increasing.
The Strongest Bearish Reversal Candlestick Patterns
The bearish reversal candlestick patterns that new traders should note are:
- Gravestone Doji Candlestick Pattern
- Evening Star Candlestick Pattern
- Shooting Star Candlestick Pattern
- Bearish Engulfing Candlestick Pattern
Gravestone Doji Bearish Reversal Candlestick Pattern
Contrary to the Dragonfly Doji pattern, the Gravestone Doji has a long upper shadow, a short lower shadow, and equal opening and closing prices.
In this pattern, the price initially rises high but then gradually decreases, and finally, the opening and closing prices are equal. If the market is on an upward trend and encounters a Gravestone Doji, caution is advised as there is a high likelihood that the price will reverse to a downward trend immediately after.

Evening Star Candlestick Pattern
The Evening Star candlestick pattern is a 3-candle pattern that meets the following conditions:
-
Candle 1: is a large-bodied declining blue candle indicating that prices are being pushed down
-
Candle 2: is a small or short-bodied candle, similar to a spinning top, Hammer, or Inverted Hammer candle. The appearance of the second candle indicates that the price has almost balanced and neither side is dominant.
-
Candle 3: is a long-bodied red candle, at least half the size of the first candle
The Evening Star pattern shows that initially, the price rose sharply to form the first blue candle, then the price gradually decreased and trading volume reduced to form the small star-like second candle, and finally a long-bodied red candle signifies the end of the uptrend and the start of a downtrend.

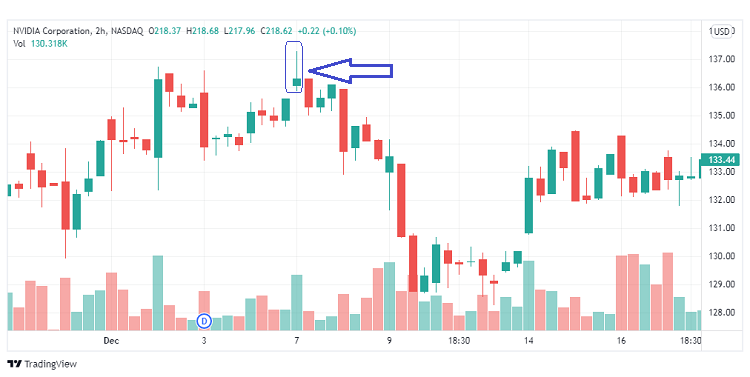
Shooting Star Candlestick Pattern
Next in the bearish reversal patterns is the Shooting Star pattern. This candlestick pattern is a single candle that resembles the Inverted Hammer. However, while the Inverted Hammer appears at the end of a downtrend, the Shooting Star appears at the peak of an uptrend.
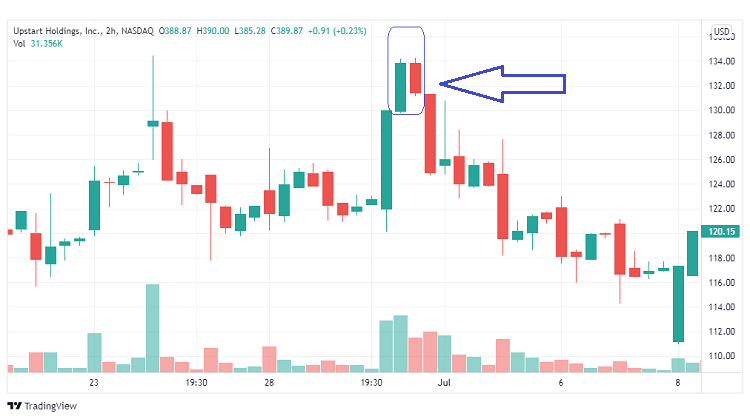
Bearish Engulfing Candlestick Pattern
Last in the top 10 Japanese candlestick reversal patterns commonly used by professional traders is the Bearish Engulfing pattern. Contrary to the Bullish Engulfing pattern, this pattern consists of two candles as follows:
- Candle 1: is a long-bodied green candle indicating an upward price trend
- Candle 2: is a long-bodied red candle larger than candle 1, showing that the sellers have gained dominance, causing the opening price to be lower than the closing price.
In this case, the larger candle 2 is compared to candle 1, the stronger the reversal signal. And compared to the Shooting Star pattern, this Bearish Engulfing pattern carries a much stronger reversal signal.
Above are the top 10 most commonly used reversal candlestick patterns in trading that traders should remember. In technical analysis, if traders can rely on these reversal candlestick patterns to accurately determine the price trend, the likelihood of losses will decrease and profits will increase.


