Do you know about technical analysis and fundamental analysis in coin investment? However, there is another equally important analysis method that always goes hand in hand with the above two methods, which is analysis based on On-Chain data. But what is On-Chain Analysis? What does it include? Where to get On-Chain data? How to analyze correctly? Let’s find out in detail in the content of the article below.
Contents
What is On-Chain Data Analysis?
What is On-Chain?
On-chain is the data on the Blockchain network, including information of all transactions that have occurred on a specific Blockchain network. Through On-Chain, you will know the most transparent and accurate data about all transactions of everyone in the market.
What does On-Chain Data include? As the blockchain stores all transactions, based on On-Chain data, you can know:
- Data about Blocks (time, gas fees, miner,…).
- Transaction volume from wallets, exchanges.
- Ownership amount from whale wallets, individual wallets.
- Information about the amount of money, tokens pushed/withdrawn from exchanges.
- Specific information about money flow.
- Information about the actions of miners.
- Information about TVL, smart contracts.
- …….
Any action on the blockchain is verified by nodes and will be updated to the overall blockchain network. On-Chain data analysis is quite new and completely different from technical analysis. But based on it, you can see the current and past situation of that blockchain, to thereby make suitable investment decisions without needing technical indicators.
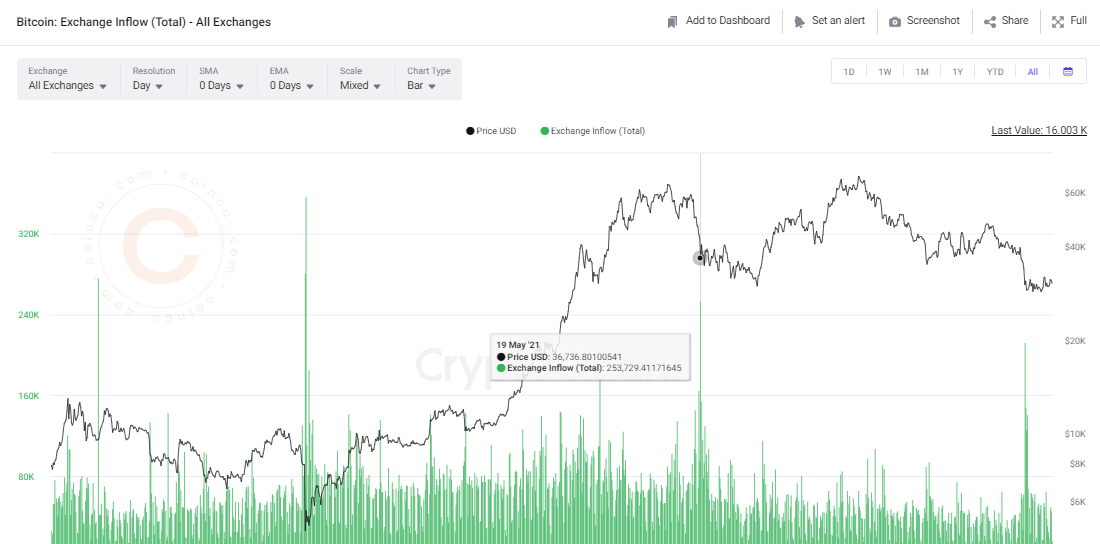
For example: Everyone knows about the collapse on 19/5 when BTC dropped from $37,000 to $29,000. But if you look at the On-Chain data, 253,729 BTC had been sent to centralized exchanges. (Exchange Inflow – is the flow of money that investors transfer from their personal wallets to Spot wallets on the exchange). That means many investors wanted to sell the token/coin they were holding (hold), so they had to transfer it to the exchange to sell. And therefore, the BTC price dropped.
It can be affirmed, On-chain data is the most truthful and transparent data. Because
Charts can be “DRAWN”
News can be “BOUGHT”
But On-chain data cannot be “FAKED”
Most Popular On-chain Data Analysis Indicators
On-chain analysis is very broad as the data recorded by the blockchain is extremely diverse, and there is no specific standard for On-chain data analysis. However, below are some information/indicators that I consider important and easiest to refer to that you can refer to:
- Total Value Locked (TVL): Simply put, this is the amount of assets being staked in a DeFi protocol. Through the volume of TVL in the network, if TVL is high, it shows that the project is very good, used by many investors, and has a lot of potential for future development.
- Information about Dev team, Investor, Miner wallets: Most of this information will be public. Through this information, you can know whether the development team, investors are accumulating or dumping tokens? From there, evaluate whether to invest or not? Or for mined coins like BTC, it is necessary to pay attention to the wallets of Miners (miners), as their buying and selling behavior also significantly affects the market.
- Amount of tokens pushed to exchanges: With this On-chain data, when a token is continuously pushed to centralized exchanges like Binance, Coinbase… then we will likely witness an adjustment or worse, a sell-off. Conversely, if that token is withdrawn from the exchange a lot, it will be a positive signal.

- Amount of Stablecoin pushed to exchanges: However, with stablecoins, the opposite is true, because when stablecoins are available on the exchange, it is a sign that market confidence is positive, many investors are ready to “buy the dip” or “prepare to buy in”. Conversely, if a lot of stablecoins are withdrawn, it shows that investors are very negative.

!
- Number of Active Wallet Addresses: An increase in the number of wallet addresses indicates that more new investors are entering the market and cryptocurrencies are gaining more attention. This can lead to an increase in the price of cryptocurrency assets. (Note that only active wallets, meaning those with a balance greater than zero, are considered). Conversely, when the number of active wallets decreases, it signifies fewer people participating in the market, leading to a potential downward trend in price fluctuations.
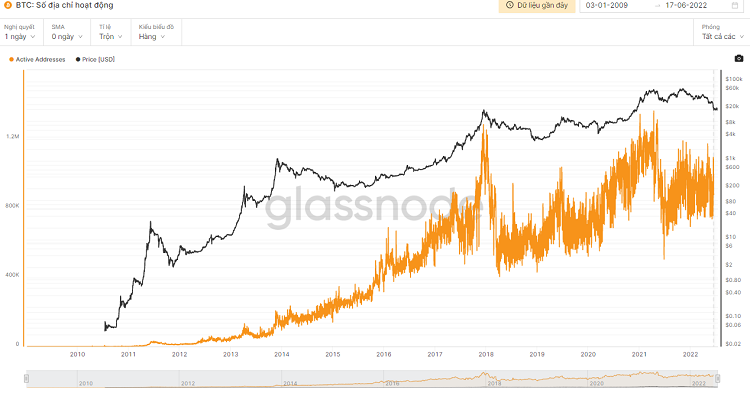
- Amount of Coins Held by Holders: On-chain analysis can check the duration that an address has not transferred cryptocurrency and the number of investors holding cryptocurrency. If the amount of coins held by cryptocurrency investors increases, it can mean that the supply of that cryptocurrency on the market will decrease, and will promote an increase in price if demand remains unchanged.
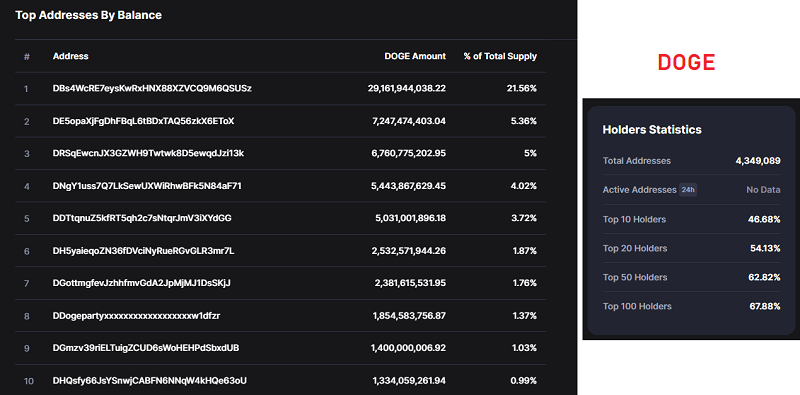
- Token Distribution Levels: This will tell you who mainly holds the majority of coins/tokens. Are they whales or individual investors? For example, if an asset is held by a few addresses that own a large percentage of the total tokens, it indicates that it is susceptible to price manipulation. Therefore, analyzing the ownership level of large token holders is also very important.
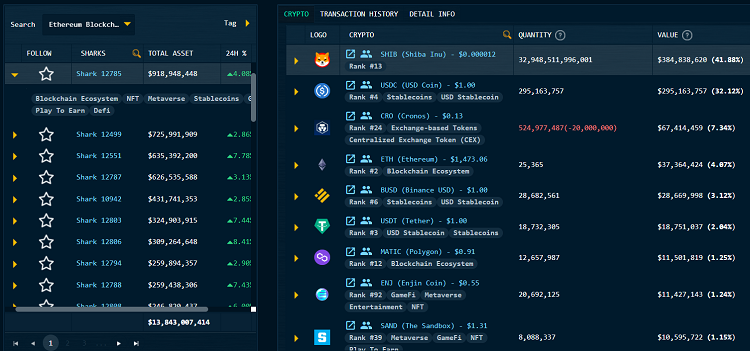
- Tracking Whale Wallets: Based on on-chain data, you can track wallets that hold large amounts of assets (whales). See if they are dumping or accumulating any particular coins, and based on this, you can make investment decisions for yourself.
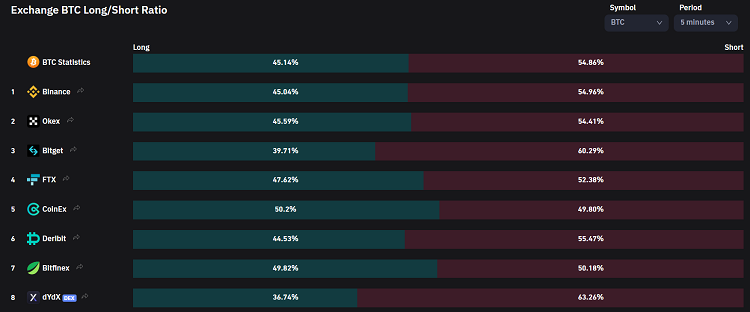
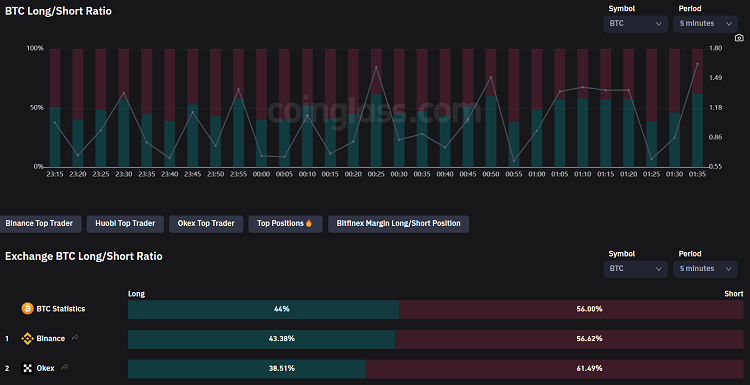
- LONG/SHORT Ratio on Exchanges: For those who trade Futures, referencing this data is very important. It will be the basis for you to know whether other investors are LONG or SHORT more. Although it is not a specific basis for any prediction or analysis, it will help you recognize the market sentiment and short-term trends, thereby making appropriate investment decisions.
*** Note that On-Chain analysis includes many other data/indicators. Depending on your analysis needs, you can choose the criteria that suit you. The above are just the simplest and most popular indicators. As you become more proficient in analysis and familiar with various analytical support tools, you will learn about many other On-Chain data analysis indicators ****
Websites that Support On-Chain Data Analysis
Have you learned about what On-Chain data is and some necessary indicators in On-Chain analysis? However, the hardest part is finding where to view On-Chain data? Fortunately, there are many websites that can greatly assist you with this. Some websites are free, but some require a fee for access. Depending on your needs, you can choose a suitable place to look up On-Chain data.
Below are some websites you can use to view the most popular On-Chain data:
Coinmarketcap.com
This website is well-known, almost every cryptocurrency investor knows it. However, many are unaware that Coinmarketcap also supports looking up some extremely useful On-Chain data, and especially it is free.
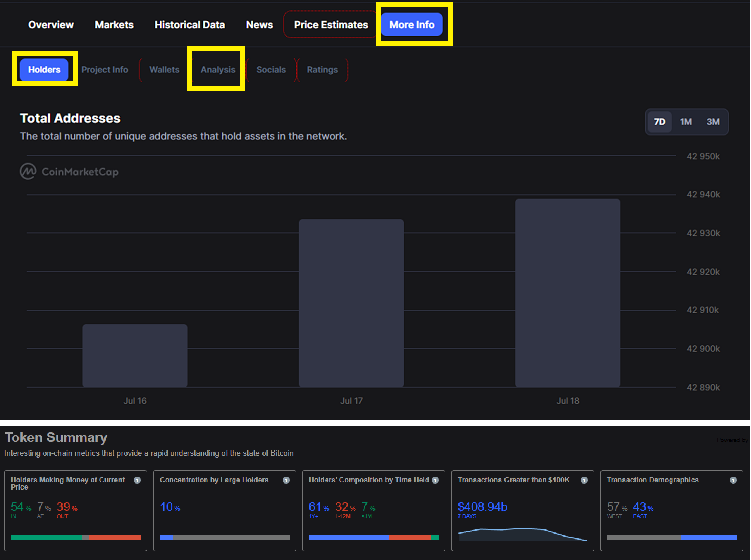
With Coinmarketcap, you can use it to view criteria such as:
- Details about holding addresses
- Amount of coins held by holders and whales
- Distribution level of tokens
Defillama.com
For those interested in DeFi projects, Defillama is an extremely useful site for On-Chain analysis. It is a transparent overview site for DeFi, with very accurate and transparent data. It lists DeFi projects from all blockchains.
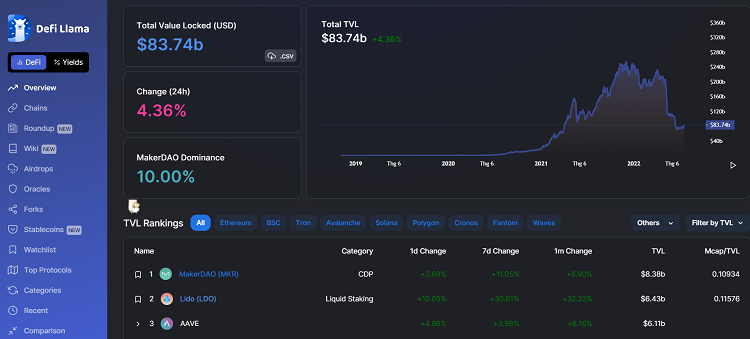
=> Use Defillama to look up TVL values, changes in TVL over time, and rank the TVL of all DeFi projects in the market.
Cryptoquant.com
This is a highly reputable and famous website for on-chain data analysis. You can use this site to access most basic on-chain data. Crypto Quant is a company specializing in providing comprehensive On-Chain analysis data, headquartered in Seoul, South Korea, and was established on September 27, 2018. Currently, this website is used by the majority of investors.
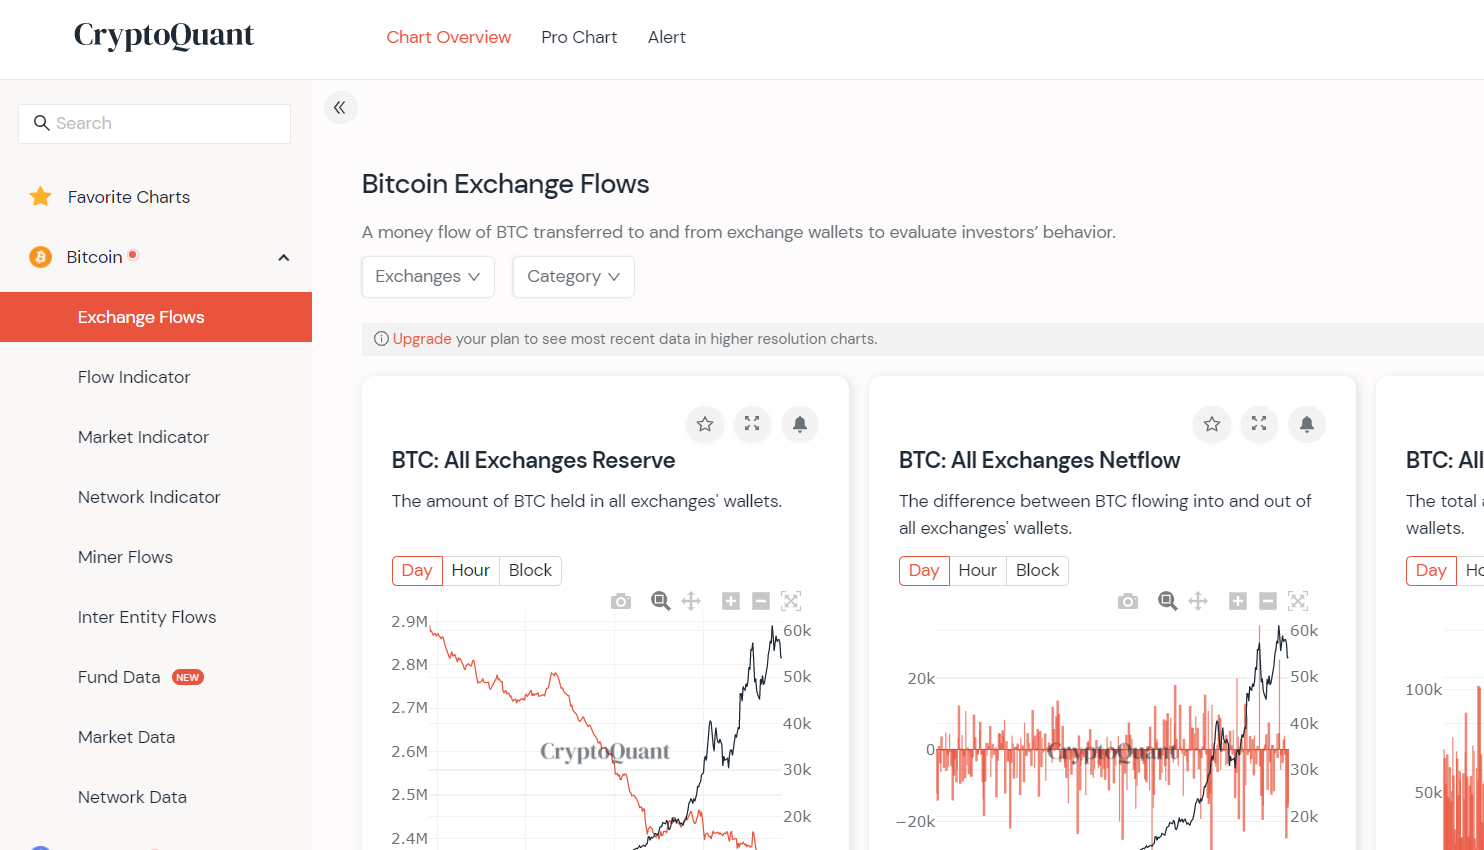
With Crypto Quant, it can help you look up many other criteria such as:
- Amount of tokens pushed to exchanges
- Statistics of buying/selling money flow of a coin
- Miners’ wallets and their trends of holding or selling
- Stablecoin reserves of exchanges
- ..etc…etc….
Glassnode.com
Glassnode is a Blockchain analysis company providing online information and data for cryptocurrency investment institutions. Compared to Cryptoquant, Glassnode offers a variety of information. However, some indicators will be delayed if you use the free version. If you want to see advanced indicators and real-time data, you will have to pay a fee.
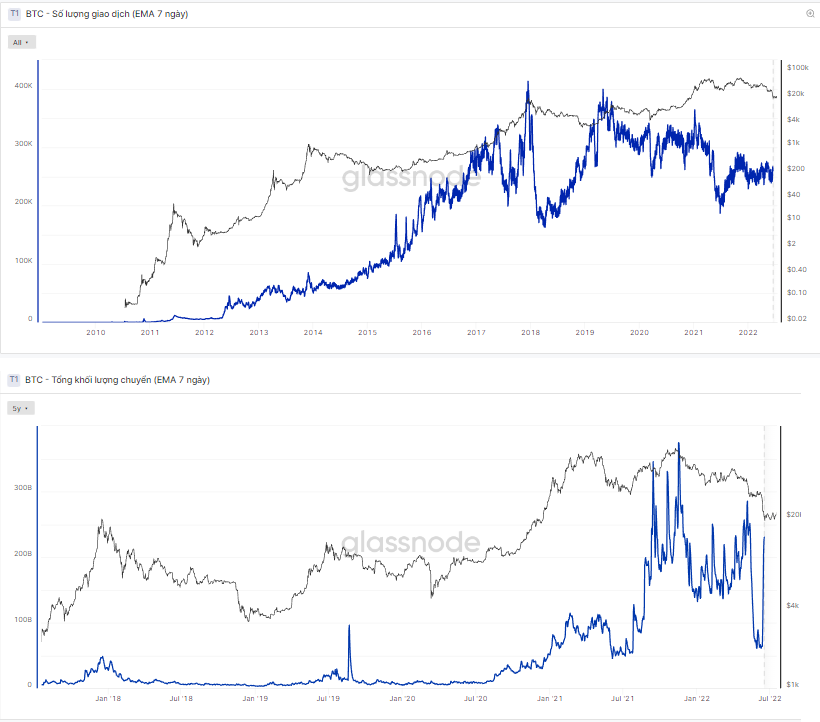
With Glassnode, you will have access to 200 indicators and 15 types of data. Furthermore, TradingView is integrated into Glassnode and allows access to all the analytical tools available in TradingView.
Theblock.co
Where to view On-Chain data? I really like Theblock.co as it’s simple, easy to use, and free. It provides almost all the indicator data I mentioned above, including information about Spot, Future trading volumes, and Stablecoins on different Blockchains.
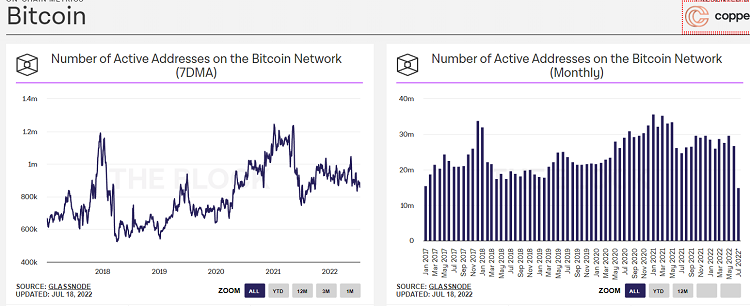
In reality, Theblock.co is not an analysis company; they buy data from Coinmetrics or Glassnode, but they provide us with a fairly complete set of On-Chain data, almost without missing anything.
Messari.io
Once you become an advanced trader, you need a more detailed view of the market and more information. Messari offers professional and advanced research features and helps you understand market dynamics deeper.
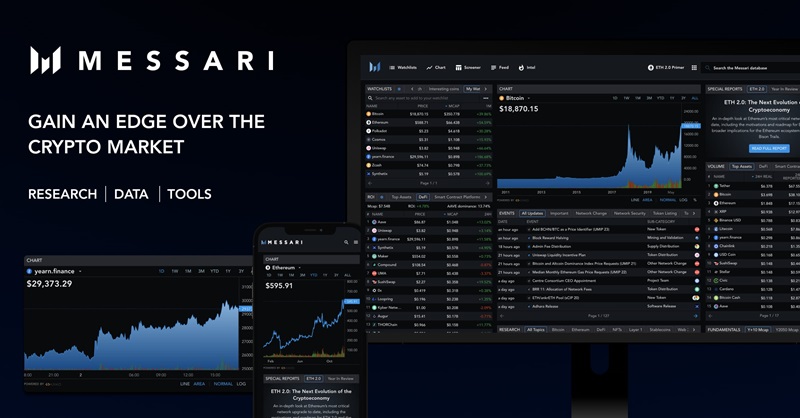
With Messari charts, you can get accurate and detailed information about each asset, including various on-chain data such as realized market capitalization, active addresses, mining fees, and more.
Sharkscan.io
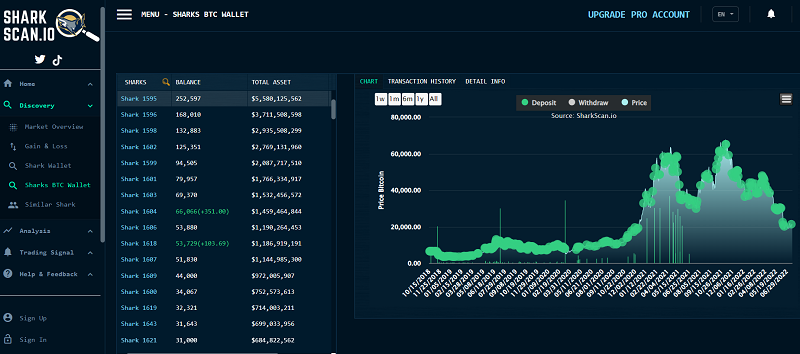
As I mentioned earlier, one very important indicator in On-Chain analysis is observing the activity of whale wallets. And no website does this better than Sharkscan.io. SharkScan is an application that allows users to track the investment portfolios of Sharks – addresses trading with assets over $50,000.
Coinglass.com
What is on-chain data? The final essential tool is Coinglass – an indispensable companion for “Long – Short” enthusiasts. Coinglass is where you can find the differences in LONG/SHORT ratios on exchanges, Liquidation, Funding Rates, detailed investments by Grayscale… In summary, it has most of the data for you to keep up with and follow the market closely.
Blockchain Explorer
Apart from the tools and websites for On-Chain data analysis mentioned above, you can visit the tracking website of each blockchain. Because tokens created on Blockchain are always transparent, we can easily look up all transactions, wallets, etc. Some tracking pages of major Blockchains now include:
- Ethereum (ETH) Blockchain: https://etherscan.io
- Binance Smart chain: https://bscscan.com
- Solana (SOL) Blockchain: https://explorer.solana.com
- Near (NEAR) Blockchain: https://explorer.near.org
So, which is the best website for On-Chain data?
The website I recommend the most is Crypto Quant, as it only requires Login to access a lot of On-Chain data, and importantly, it’s free. Meanwhile, Glassnode, despite having features and advanced analysis indicators, requires a fee, so if you’re not a professional analyst, you can skip it.
Or you can use websites like Coinmarket.com and Theblock.co for those who want quick, simple lookups.
Especially, always use Defillama.com to check TVL, and Coinglass.com to check LONG/SHORT ratios on exchanges, or Sharkscan.io to view “whale” information. These websites are unique in the list because they provide different data from the others.
It’s evident that On-Chain data is an extremely powerful tool in helping you make investment decisions. However, it requires users to have certain knowledge to use it effectively. Therefore, through this article, I hope you have somewhat understood what is On-Chain data analysis is, as well as the first steps to getting familiar with it. Remember to practice regularly to gain more experience. Wishing you successful investments.
Readmore: The Ultimate List: 60 Best Free Crypto Websites and Tools


