If you’re an investor in the stock, coin, forex markets, you’ve surely heard the term “Japanese Candlestick” many times, right? Japanese Candlesticks Patterns are an extremely useful tool for recognizing market fluctuation signals that every technical analyst must use. But specifically, what are Japanese Candlesticks, their characteristics, what types of candlestick patterns exist…? Let invest286.com share with you in the content of this article.
What is a Japanese Candlestick Pattern?
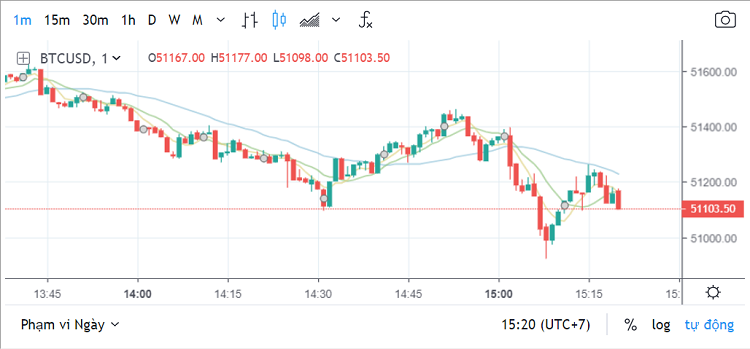
What are Japanese Candlestick?
What are the uses of Japanese Candlestick? Individual Japanese candlesticks come together to form a Japanese candlestick pattern. These patterns can provide early warnings of market continuation or reversal.
A Japanese candlestick chart will have many candles, and you can adjust it to the time frame you desire, such as: 1 minute, 5 minutes, 15 minutes, 1 hour, 1 day, 1 week, 1 month…

For example: If you choose to view a 1-minute chart, then every minute a candlestick is created. If you choose to view a 1-hour chart, then every hour a candlestick is created.
Where did the Japanese Candlestick Patterns originate?
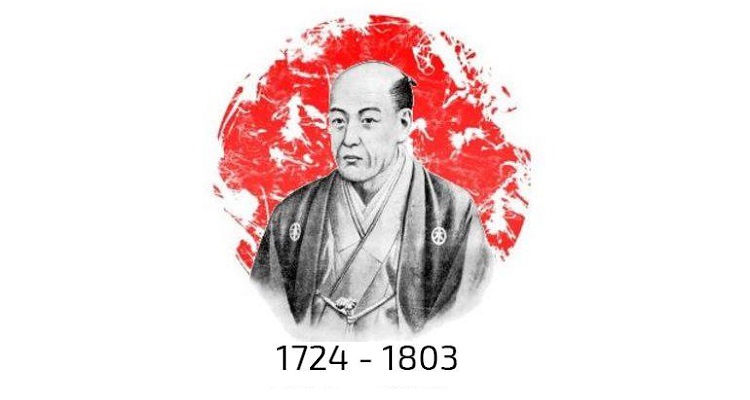
After understanding what is Japanese Candlestick pattern, are you curious about its origins? The Japanese Candlestick model was created by a Japanese trader in the 18th century, named Munehisa Homma.
At that time, Munehisa Homma used a chart called the candlestick chart to represent the fluctuations of rice prices in Japan over many years. He then combined this with an analysis of economic conditions, weather, and government policies to find the patterns of rice price movements. Thanks to this, Munehisa Homma managed to control the entire Japanese rice market for a while and build his own speculation strategy. Therefore, his candlestick chart gained significant attention.

Later on, his Japanese Candlestick Patterns was widely introduced to many Western countries and was well-received, leading to its widespread use today. The greatest contribution must be attributed to Steve Nison – a leading expert on Japanese candlestick models.
Nowadays, investors following technical analysis typically use Japanese Candlestick models as a basic tool for analysis and combine them with other indicators to make their trading decisions.
Guide to Reading and Understanding Japanese Candlestick
To accurately understand what is Japanese Candlesticks are and their functions, you need to grasp the structure of a Japanese candlestick.
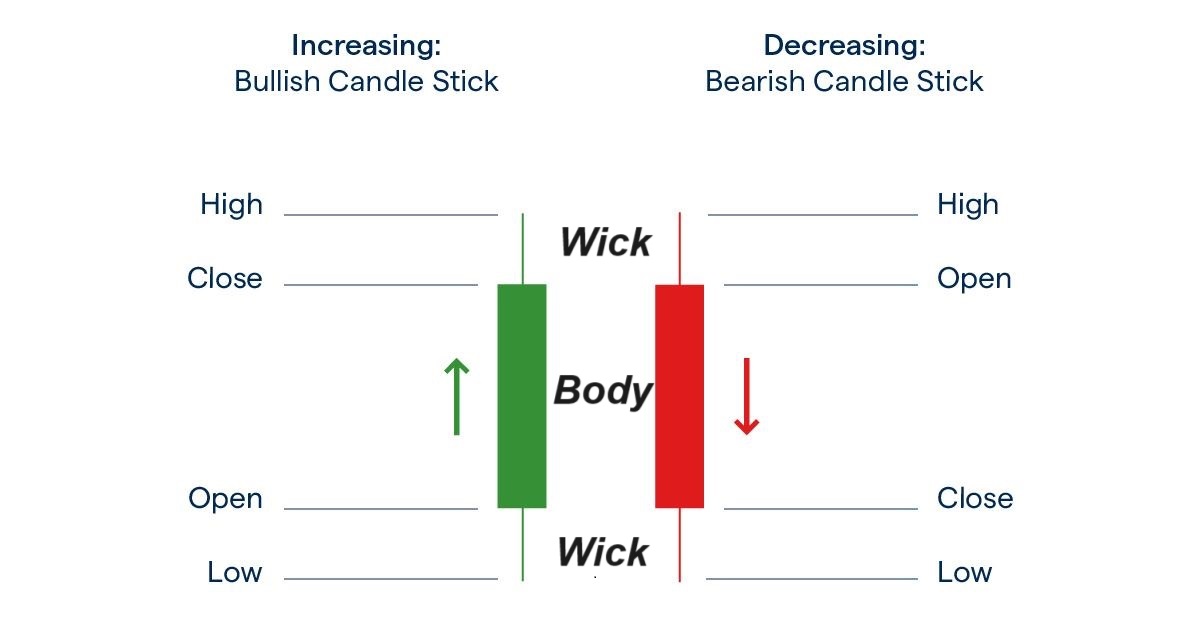
Below is an image depicting the structure of a Japanese candlestick:

Candlestick colors:
Japanese candlesticks on the chart can be green and red (on some charts, they are black and white). Based on the color, we can deduce:
- Price increase candles: If the closing price > opening price, then the candlestick will be green (or white)
- Price decrease candles: If the closing price < opening price, then the candlestick will be red (or black)
Total candle length:
The total length of the candle is measured from the bottom to the top of the entire candlestick (including both the body and the wick). The length of the candle indicates the price volatility during the trading session. Longer candles indicate significant market fluctuations, while shorter candles show a relatively calm market.
Candle body::
The candle body is the rectangular part, indicated by green or red color (or white or black). The difference between the opening and closing prices is the length of the candle body.
- A green body indicates that buying volume > selling volume, leading to a rising trend. The longer the body, the stronger the buying pressure.
- A red body indicates that selling volume > buying volume, leading to a declining trend. The longer the body, the stronger the selling pressure.
Candle wick:
The candle wick is the small straight line protruding above or below the candle body, indicating the lowest and highest prices during the trading session (from opening to closing).
- The upper wick indicates that the market was experiencing a price increase at that time. It shows that buyers were buying in large quantities, pushing the price up, but strong selling pressure forced the price back down. The longer the upper wick, the stronger the selling pressure.
- The lower wick indicates that the market was experiencing a price decrease at that time. It shows that sellers were offloading a large quantity, causing the price to drop significantly, but high buying pressure at that time caused the price to rise again. The longer the lower wick, the stronger the buying pressure.
A Japanese candlestick is composed of both a candle body and wicks, and both depict market action. When talking about Japanese candlestick analysis, it means you will analyze the shape of the candle and the order they stand next to each other, then interpret the psychology and behavior of investors in the market.
The Japanese Candlestick pattern represents the fierce battle between buyers and sellers over a specified time period.
-
If the candle body is short and there are no wicks (or short wicks), it indicates that neither side has the upper hand, and the price has hardly changed from the beginning.
-
The longer the wick, the more it indicates that each side pushes the price in the opposite direction. If the closing price is equal to the opening price at the end of the session, it means both sides are intensely fighting, with neither side winning.
Most Common Japanese Candlestick Patterns
As you can see on the chart, there is not just one candlestick but thousands. When combined, they provide traders with a wealth of information. Depending on the color, shape, length of the wicks, or body, they are given abstract names like hammer, wrestler, evening star, morning star, shooting star, hanging man…
Japanese candlestick patterns are used to predict the direction of price movements. For new traders unfamiliar with charts, start by identifying single, double (two candlesticks combined), and triple candlestick patterns (three candlesticks combined).
Below are the most common Japanese candlestick patterns you need to know when learning about what Japanese candlestick patterns are and how to trade with them.
Illustration | Name | Characteristic | Continue or reverse | GUIDE |
Standard | Single candle. The candle body and shadow are proportional to each other. | Both | ||
Marubozu | Single candle. Only the body, no shadow (if there is, it is very short) | Continue | ||
Hammer | Single candle. There is no upper shadow (or very short), the lower shadow is very long. Appears at the end of a downtrend. | Reverse | ||
Inverted Hammer | Single candle. There is no lower candle shadow (or very short), the upper candle shadow is very long. Appears at the end of a downtrend. | Reverse | ||
Spinning Tops | Single candle. The candle body is small, the base, and the candle shadows at both ends are very long. | Both | ||
Doji | No candle body (closing and opening prices are equal) | Both | ||
Shooting Star | Looks like an Inverted Hammer candlestick, but appears at the end of an uptrend. | Reverse | ||
Hanging Man | Similar to a hammer candlestick, but appears at the end of an uptrend. | Reverse | ||
Bullish Engulfing | Double candles. The 1st candle is red, very small. The second candle is green, large, covering the first candle. | Reverse | ||
Bearish Engulfing | Double candles. The 1st candle is blue, very small. The second candle is red, large, covering candle 1. | Reverse | ||
Bullish Harami | Double candles. The 1st candle is red and long. The second candle is green, small, and fits inside the body of candle 1. | Both | ||
Bearlish Harami | Double candles. The 1st candle is green and long. The second candle is red, small, and fits inside the body of candle 1. | Both | ||
Pin Bar | Looks like a hammer candle, Shooting Star..., but not necessarily a reversal. | Both | ||
Inside Bar | With multiple candles, there is a mother candle standing first, then there will be child candles inside. | Both | ||
Tweezer Tops và Bottoms | The 2 candles have opposite colors and the shadows are the same size. | Reverse | ||
Morning Star | 3 candles: Candle 1 is red and long, candle 2 has short bodies (doji, hammer...), candle 3 has long blue bodies. | Reverse | ||
Evening star | 3 candles: Candle 1 is green and long, Candle 2 has short bodies (doji, hammer...), Candle 3 has long red bodies. | Reverse | ||
Three White Soldier | 3 consecutive green candles, small shadows. The opening and closing prices of the following candle gradually become higher than the previous candle. | Reverse | ||
Three Black Crows | 3 consecutive red candles, small shadows. The opening and closing prices of the following candle gradually become lower than the previous candle. | Reverse | ||
Rising Three Methods | 3 nến đỏ liên tiếp xuất hiện sau 1 cây nến xanh lớn. | Continue | ||
Falling three methods | 3 consecutive green candles appear after 1 large red candle. | Continue | ||
Piercing line | Candle 1 is long red, candle 2 is long green. The closing price of candle 2 is higher than the middle of candle 1's body. | Reverse | ||
Dark cloud cover | Candle 1 is long green, candle 2 is long red. The closing price of candle 2 is higher than the middle of candle 1's body. | Reverse |
Experience Using Japanese Candlestick Patterns
After extensive use of Japanese candlestick patterns, we have gleaned some insights and would like to share them with you:
-
Reversal candlestick patterns are more effective than continuation patterns. This is because reversal patterns are easier to identify and provide more reliable signals.
-
When using Japanese candlestick patterns, it’s best to look for reversal patterns, rather than wasting time searching for continuation patterns.
-
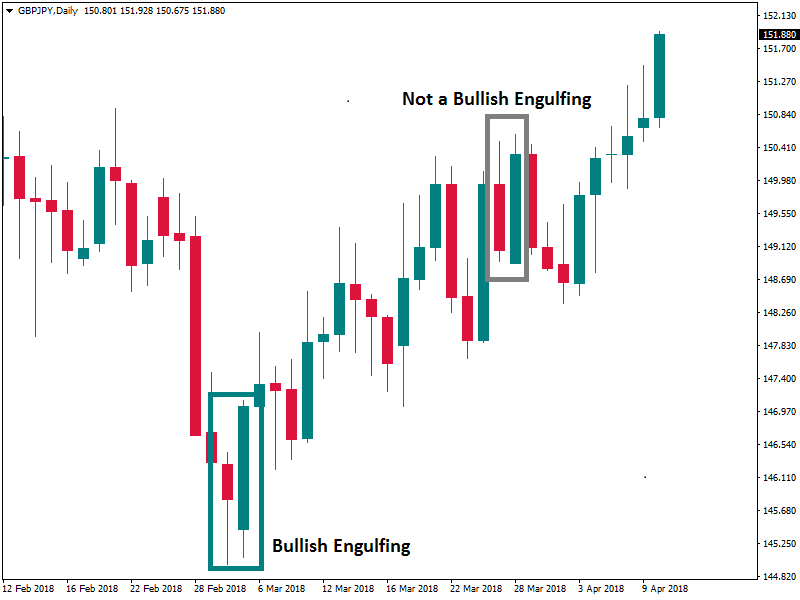
A candlestick pattern has two criteria: the shape of the pattern and the trend preceding it. If it only meets one of these criteria, it is not enough to be a signal.
For example, in the image below, the first pattern is indeed a bullish engulfing as it forms after a significant downtrend. In the second case, the pattern looks like a bullish engulfing but does not occur because there is no clear preceding downtrend.

-
Doji candlesticks signal reversals when they are after a trend or near support/resistance levels. If a doji is within a sideways range, it does not provide much of a signal.
-
Doji candlesticks can reinforce other signals. For example, a Doji combined with a Harami is likely to create a strong reversal.
-
The presence of multiple Pin bars together is a sign that the market is tired and no longer wants to move in that direction. The presence of a series of candlesticks with long shadows shows that investor psychology is changing.

-
The Hammer candlestick can be any color. However, if it is green, the buying signal is much stronger. Regularly monitor the Japanese candlestick chart to find signals, especially near peaks or troughs.
-
Pay attention to the most distorted, unusual candles, as they give more signals. If a Japanese candlestick pattern signal is very obvious, it’s good because many other traders will also detect it like you, and act accordingly.
-
When analyzing Japanese candlestick reversal patterns, in many cases, it is necessary to wait for the candle to close to confirm whether a reversal pattern has formed or not.
-
There are hundreds of different Japanese candlestick patterns, but it is advisable to know only a few, but understand them well. Learn thoroughly about Doji, Hanging man, Hammer, Shooting star, Engulfing, Harami, and Inside bar patterns.
We hope that through this article, you have somewhat understood what is Japanese Candlestick, how to read them, and learned about the most common Japanese candlestick patterns today. Japanese candlestick patterns are tools that represent market prices and the actions of the buying and selling sides. However, to become a wise investor, combine other technical analysis methods to increase your chances of success in trading. Thank you for reading.


